HOW TO: Reading the Daily Chart on XLM - getting ready to ShortIn this video I will demonstrate how I read the chart using two indicators Weis Wave with Speed Index Signals and Weis Wave - Wave Types.
Enjoy!
Related pairs

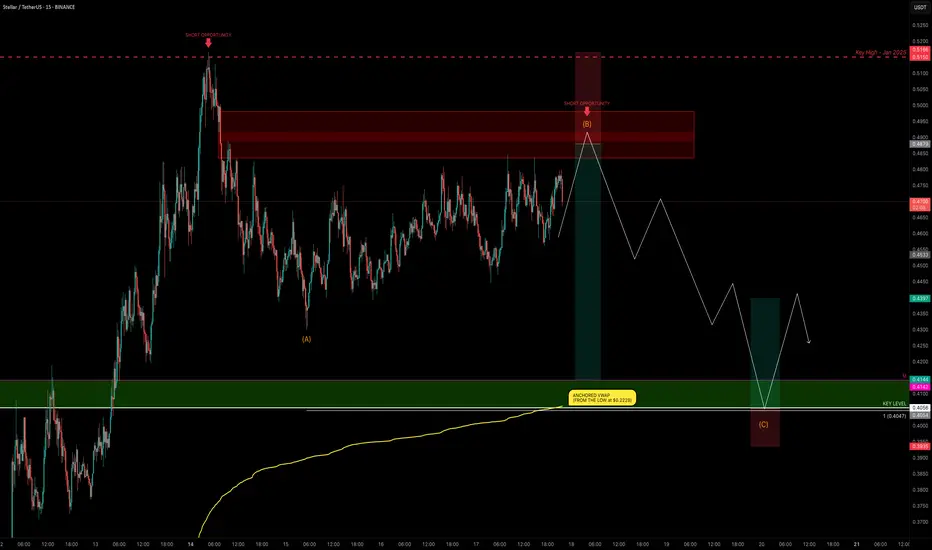
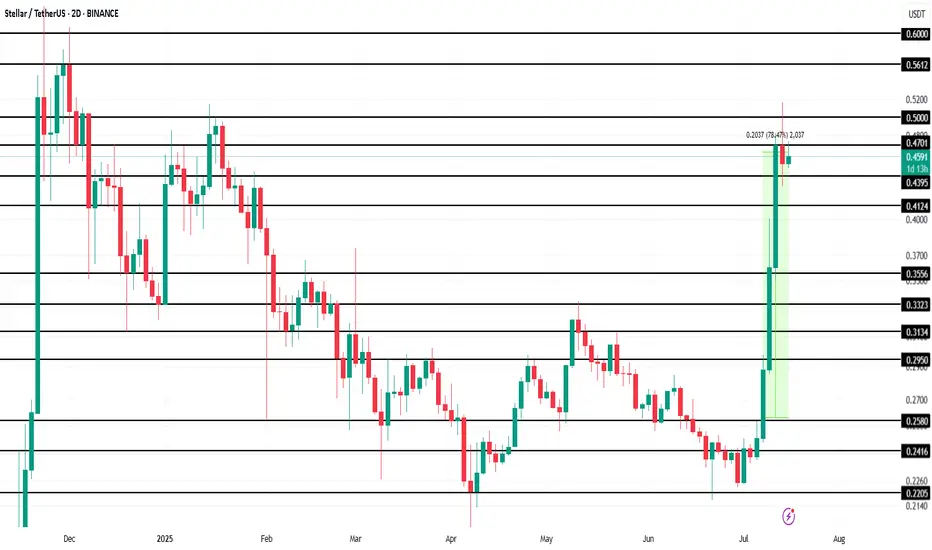
XLM Explodes +132% — Is the Party Over or Just Starting?XLM has been one of the top movers, sweeping the January 2025 swing high at $0.515 before stalling and moving sideways for the past 4 days.
Is XLM gearing up for another push toward the highs, or is a correction imminent?
Let’s dive into the details.
🧩 Market Structure & Fractal Pattern
XLM sk
Stellar Price Set to Rise: $0.95, $1.35, $1.80 AheadHello✌
Let’s analyze Stellar’s upcoming price potential 📈.
BINANCE:XLMUSDT , I expect a long-term upward bullish trend.
There are three main targets in this analysis: $0.95, $1.35, and a final target of $1.80, which could be reached within 2 to 6 years.
The price may form parallel channels at t

Stellar (XLM): Bearish CME + Potential Buy Entries | Bullish!Stellar is building up for the major resistance zone near $0.60, which is also our target currently.
We have set 2 entry zones for buy trades, where the upper one will be activated once we form the proper BOS, but due to the fact that we have bearish CME, we also set a second entry in case we go an

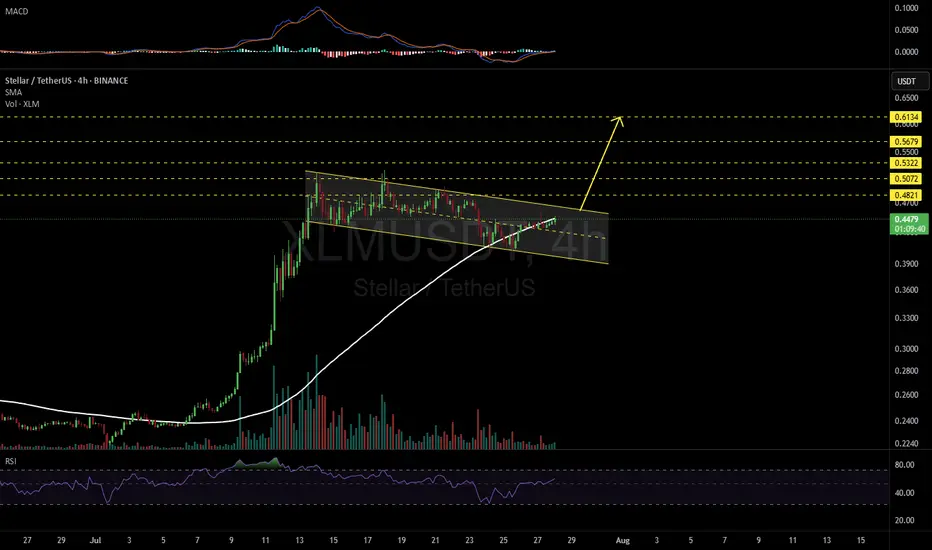
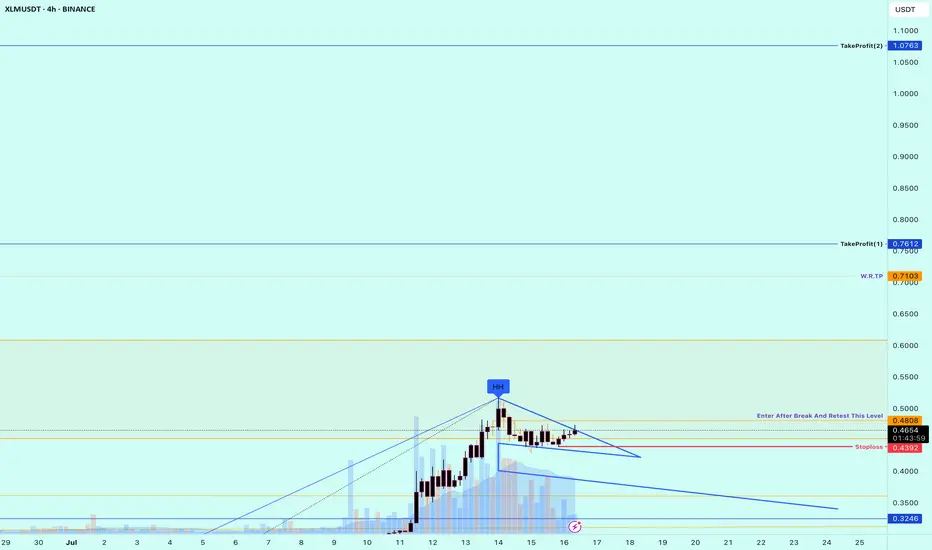
XLMUSDT 4H#XLM has formed a bullish flag on the 4H timeframe. In case of a breakout above the flag and the SMA100, the potential upside targets are:
🎯 $0.4821
🎯 $0.5072
🎯 $0.5322
🎯 $0.5679
🎯 $0.6134
⚠️ As always, use a tight stop-loss and apply proper risk management.
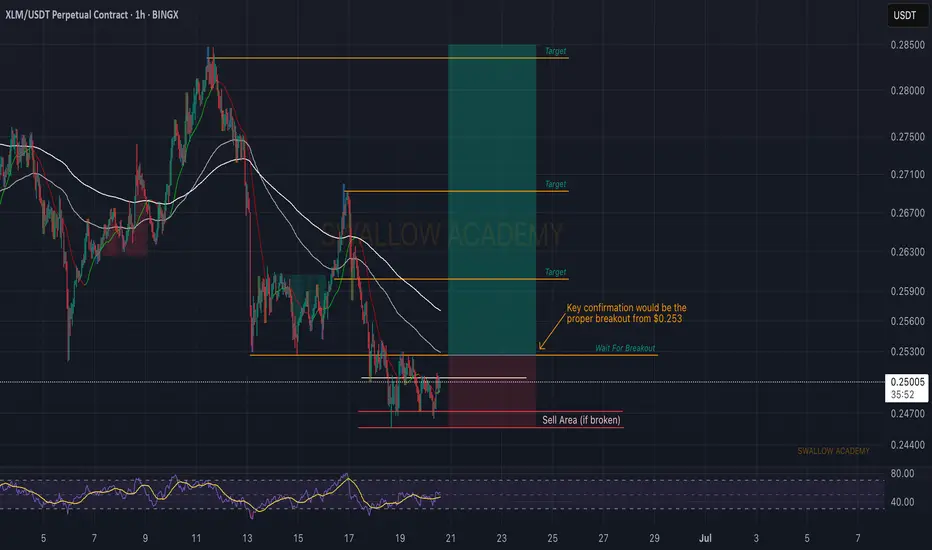
Stellar (XLM): Waiting For Breakout | Good Risk:RewardStellar coin is in an early stage for potential good upward movement from here. We see some kind of buyside volume forming here, which could give us a proper breakout, which we are waiting for.
As soon as we get it, we will be longing for $0.253.
Swallow Academy
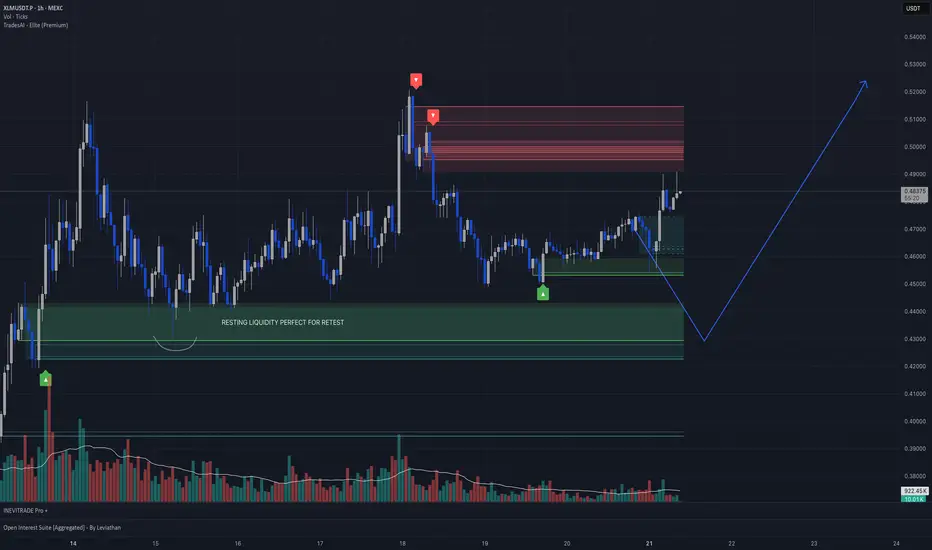
XLM/USDT 1-hour chart analysisHey everyone! Thrilled to present my first TradingView idea! Check out this XLM/USDT 1-hour chart from MEXC. I’ve identified a key “resting liquidity” zone at 0.4100–0.4200, where I expect a retest soon. The price surged from 0.4000 to 0.5200, hit resistance, and is now consolidating around 0.47388.
Stellar Eyes 14% Upside, Targeting 0.30$Hello✌
All previous targets were nailed ✅! Now, let’s dive into a full analysis of the upcoming price potential for Stellar 📈.
BINANCE:XLMUSDT has convincingly broken above its daily descending channel resistance 📈 and is holding near a strong support level. This setup suggests a potential ups

Stellar (XLM) Makes History Amid 78% Price Surge This WeekBINANCE:XLMUSDT is currently trading at $0.46, up 78.5% over the past week . However, the altcoin faces resistance at $0.47, a level it has struggled to breach in recent days. The ability to break this resistance is crucial for continued growth, as it will determine whether XLM can push higher.
B
Buy Trade Strategy for XLM: Powering Fast and Inclusive PaymentsDescription:
This trading idea highlights XLM (Stellar Lumens), the native asset of the Stellar network — a blockchain platform built to enable fast, low-cost, and borderless financial transactions. XLM is designed to facilitate cross-border payments and connect financial institutions, payment syst
See all ideas
Summarizing what the indicators are suggesting.
Oscillators
Neutral
SellBuy
Strong sellStrong buy
Strong sellSellNeutralBuyStrong buy
Oscillators
Neutral
SellBuy
Strong sellStrong buy
Strong sellSellNeutralBuyStrong buy
Summary
Neutral
SellBuy
Strong sellStrong buy
Strong sellSellNeutralBuyStrong buy
Summary
Neutral
SellBuy
Strong sellStrong buy
Strong sellSellNeutralBuyStrong buy
Summary
Neutral
SellBuy
Strong sellStrong buy
Strong sellSellNeutralBuyStrong buy
Moving Averages
Neutral
SellBuy
Strong sellStrong buy
Strong sellSellNeutralBuyStrong buy
Moving Averages
Neutral
SellBuy
Strong sellStrong buy
Strong sellSellNeutralBuyStrong buy
Displays a symbol's price movements over previous years to identify recurring trends.
Frequently Asked Questions
The current price of Stellar / TetherUS (XLM) is 0.4158 USDT — it has fallen −0.02% in the past 24 hours. Try placing this info into the context by checking out what coins are also gaining and losing at the moment and seeing XLM price chart.
Stellar / TetherUS price has fallen by −11.40% over the last week, its month performance shows a 75.43% increase, and as for the last year, Stellar / TetherUS has increased by 314.97%. See more dynamics on XLM price chart.
Keep track of coins' changes with our Crypto Coins Heatmap.
Keep track of coins' changes with our Crypto Coins Heatmap.
Stellar / TetherUS (XLM) reached its highest price on May 16, 2021 — it amounted to 0.7985 USDT. Find more insights on the XLM price chart.
See the list of crypto gainers and choose what best fits your strategy.
See the list of crypto gainers and choose what best fits your strategy.
Stellar / TetherUS (XLM) reached the lowest price of 0.0260 USDT on Mar 13, 2020. View more Stellar / TetherUS dynamics on the price chart.
See the list of crypto losers to find unexpected opportunities.
See the list of crypto losers to find unexpected opportunities.
The safest choice when buying XLM is to go to a well-known crypto exchange. Some of the popular names are Binance, Coinbase, Kraken. But you'll have to find a reliable broker and create an account first. You can trade XLM right from TradingView charts — just choose a broker and connect to your account.
Crypto markets are famous for their volatility, so one should study all the available stats before adding crypto assets to their portfolio. Very often it's technical analysis that comes in handy. We prepared technical ratings for Stellar / TetherUS (XLM): today its technical analysis shows the neutral signal, and according to the 1 week rating XLM shows the buy signal. And you'd better dig deeper and study 1 month rating too — it's strong buy. Find inspiration in Stellar / TetherUS trading ideas and keep track of what's moving crypto markets with our crypto news feed.
Stellar / TetherUS (XLM) is just as reliable as any other crypto asset — this corner of the world market is highly volatile. Today, for instance, Stellar / TetherUS is estimated as 5.15% volatile. The only thing it means is that you must prepare and examine all available information before making a decision. And if you're not sure about Stellar / TetherUS, you can find more inspiration in our curated watchlists.
You can discuss Stellar / TetherUS (XLM) with other users in our public chats, Minds or in the comments to Ideas.