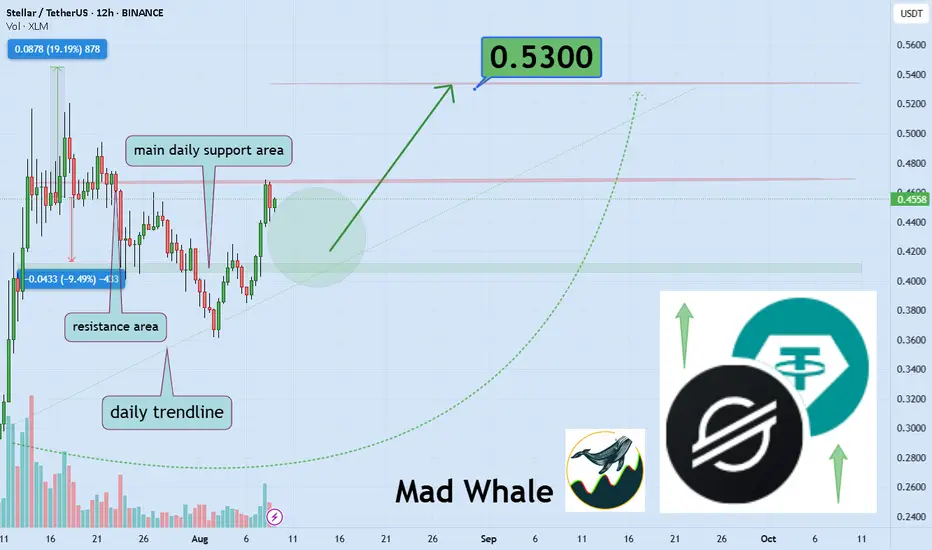
Stellar’s Daily Support Could Trigger 19% Move To $0.53Hello✌️
Let’s analyze Stellar’s price action both technically and fundamentally 📈.
🔍Fundamental analysis:
Stellar’s Protocol 23 upgrade adds Soroban smart contracts and faster transactions, aiming for 5,000 TPS to compete with Ethereum in DeFi. 🚀
📊Technical analysis:
BINANCE:XLMUSDT is
Related pairs
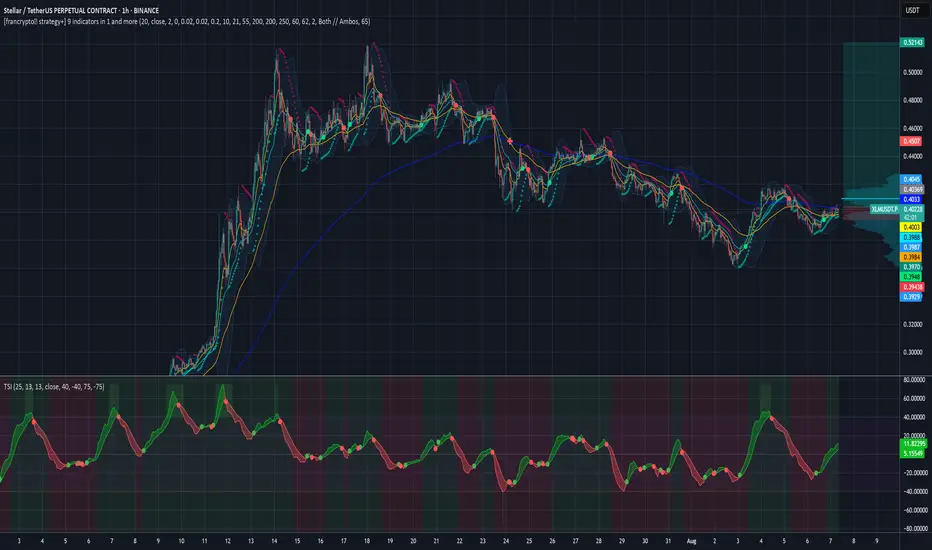
Bullish on XLMUSDTStellar / XLM turns bullish again, retracement is over. We have an EMA cross, we have passed an high volume node and now we try to move above EMA200. As soon as we manage to stay above we will head for the targets around 0.46$ and 0.52$.
For more trade ideas check and insights check our profile.
Stellar (XLM): Proper Break of Structure (BoS) | Bullish We had a clean breakout on the XLM coin where the price did form the Break of Structure, and now we are aiming for that resistance zone near $0.50.
Even that zone is not the final stop for us; we look for that major target zone (which is major resistance on a bigger timeframe) to be reached!
Swal

XLM - Trading PlanBINANCE:XLMUSDT Price is trading above the monthly pivot and pushing higher. I expect a local pullback to the moving averages ; after confirmation, I’ll look for long entries.
Plan: 🔄
• Entry: after a clean retest/hold of MAs
• TP1 : R2 at 0.5655 🎯
• TP2 : R3 at 0.6792

XLMUSDT LONGSee that we having a great pump with the alt coins and ETH leading the heard I think we have a great opportunity for a long trade on Stellar if we break the small bull flag to the upside see that it has not yet been performing as much as other coins. Please feel free to give any input or leave a c

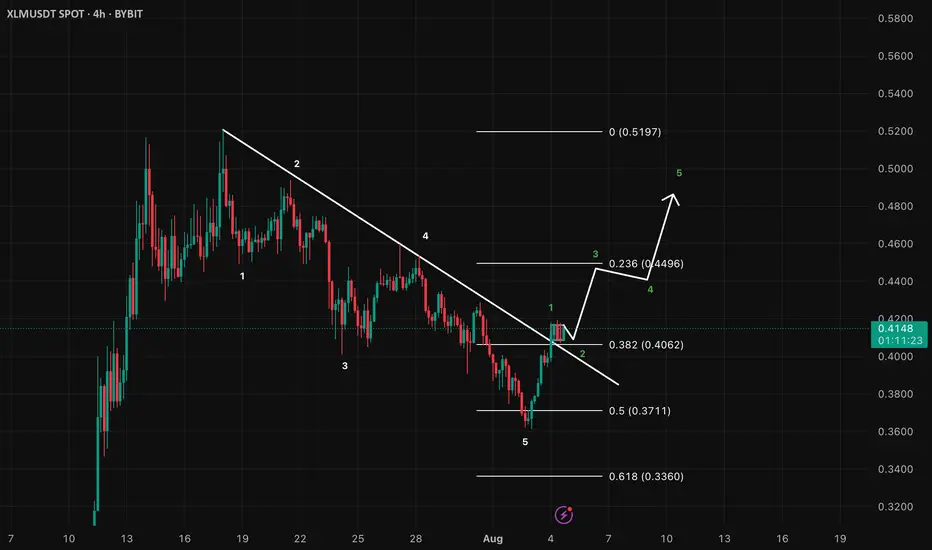
XLMUSD LongWe´ve completed a 5wave corrective structure and just started another bullish 5wave structure.
I expect a correction on lower timeframe to confirm the end of the 1st wave and will enter Long trade at the breakout
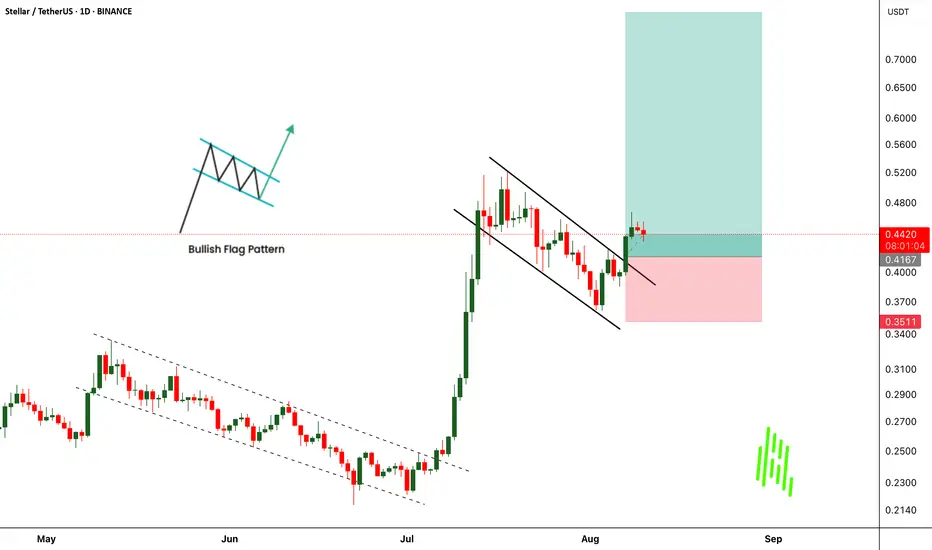
XLMUADT Ready for Another Moonshot After Bullish Flag Breakout!$XLMUADT has just broken out of a well-formed bullish flag pattern, signaling the potential start of a strong upward move. This comes after its earlier breakout from a rising channel, which delivered impressive gains to traders who caught the move. The current breakout setup mirrors that previous ra
XLM Price holding multi-TF Bull FVGCRYPTOCAP:XLM is trading inside a multi-timeframe Bullish FVG cluster (0.40 – 0.4368) with confluence from 1W, 1D, and 4H charts. Price is holding above POI that previously triggered bullish continuation.
Bullish scenario (#long):
Accumulate within 0.42 – 0.41 zone.
Breakout above 4H Sell FVG (0

XLMUSDT 1H Market OutlookBINANCE:XLMUSDT
Trade Setup:
Target 1: 0.4513
Target 2: 0.4872
Target 3: 0.5231
Target 4: 0.1808
Stop Loss: 0.3795
Pattern: The chart indicates a "CHOCH" (Change of Character) pattern, suggesting a potential trend reversal or continuation depending on context.
Trend: Recent price acti


See all ideas
Summarizing what the indicators are suggesting.
Oscillators
Neutral
SellBuy
Strong sellStrong buy
Strong sellSellNeutralBuyStrong buy
Oscillators
Neutral
SellBuy
Strong sellStrong buy
Strong sellSellNeutralBuyStrong buy
Summary
Neutral
SellBuy
Strong sellStrong buy
Strong sellSellNeutralBuyStrong buy
Summary
Neutral
SellBuy
Strong sellStrong buy
Strong sellSellNeutralBuyStrong buy
Summary
Neutral
SellBuy
Strong sellStrong buy
Strong sellSellNeutralBuyStrong buy
Moving Averages
Neutral
SellBuy
Strong sellStrong buy
Strong sellSellNeutralBuyStrong buy
Moving Averages
Neutral
SellBuy
Strong sellStrong buy
Strong sellSellNeutralBuyStrong buy
Displays a symbol's price movements over previous years to identify recurring trends.
Frequently Asked Questions
The current price of Stellar / TetherUS (XLM) is 0.4535 USDT — it has risen 0.93% in the past 24 hours. Try placing this info into the context by checking out what coins are also gaining and losing at the moment and seeing XLM price chart.
Stellar / TetherUS price has risen by 14.55% over the last week, its month performance shows a −3.63% decrease, and as for the last year, Stellar / TetherUS has increased by 358.54%. See more dynamics on XLM price chart.
Keep track of coins' changes with our Crypto Coins Heatmap.
Keep track of coins' changes with our Crypto Coins Heatmap.
Stellar / TetherUS (XLM) reached its highest price on May 16, 2021 — it amounted to 0.7985 USDT. Find more insights on the XLM price chart.
See the list of crypto gainers and choose what best fits your strategy.
See the list of crypto gainers and choose what best fits your strategy.
Stellar / TetherUS (XLM) reached the lowest price of 0.0260 USDT on Mar 13, 2020. View more Stellar / TetherUS dynamics on the price chart.
See the list of crypto losers to find unexpected opportunities.
See the list of crypto losers to find unexpected opportunities.
The safest choice when buying XLM is to go to a well-known crypto exchange. Some of the popular names are Binance, Coinbase, Kraken. But you'll have to find a reliable broker and create an account first. You can trade XLM right from TradingView charts — just choose a broker and connect to your account.
Crypto markets are famous for their volatility, so one should study all the available stats before adding crypto assets to their portfolio. Very often it's technical analysis that comes in handy. We prepared technical ratings for Stellar / TetherUS (XLM): today its technical analysis shows the buy signal, and according to the 1 week rating XLM shows the buy signal. And you'd better dig deeper and study 1 month rating too — it's strong buy. Find inspiration in Stellar / TetherUS trading ideas and keep track of what's moving crypto markets with our crypto news feed.
Stellar / TetherUS (XLM) is just as reliable as any other crypto asset — this corner of the world market is highly volatile. Today, for instance, Stellar / TetherUS is estimated as 3.38% volatile. The only thing it means is that you must prepare and examine all available information before making a decision. And if you're not sure about Stellar / TetherUS, you can find more inspiration in our curated watchlists.
You can discuss Stellar / TetherUS (XLM) with other users in our public chats, Minds or in the comments to Ideas.