XLM Breakout Alert – Hidden Gem About to Explode?XLM/USDT is showing signs of a potential breakout from a long-term descending trendline that has been in play since November 2024. Price recently rebounded from a key demand zone (highlighted in yellow), suggesting strong buying interest at lower levels.
📉 Descending Trendline Resistance
The pair h
Related pairs

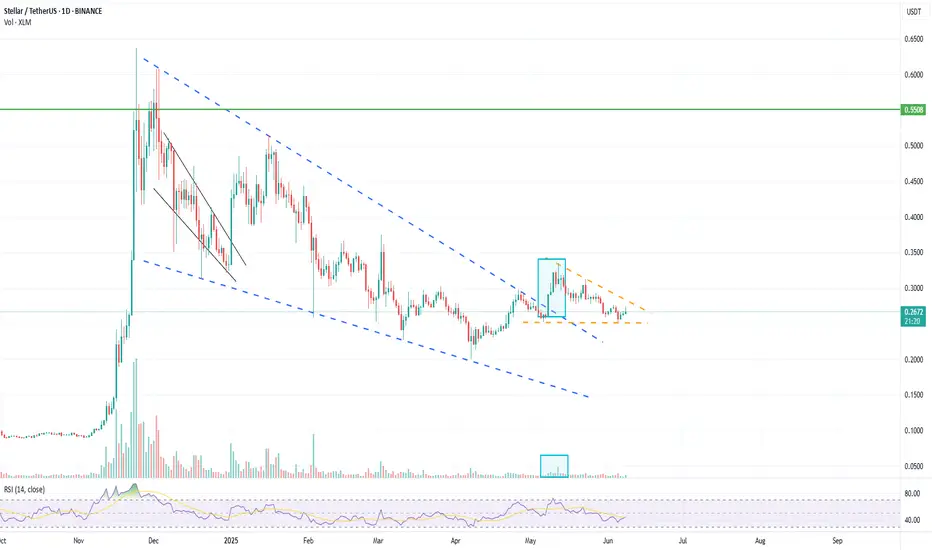
Stellar (XLM): Possible Buying Opportunity | Price Near SupportStellar coin has been forming some sort of bullish trend, where price has reached the lower side of that trend where buyers took over the area.
Now we are looking for that same momentum to continue and break the EMAs, which would then lead the price towards the upper side of the bullish trend.
Sw

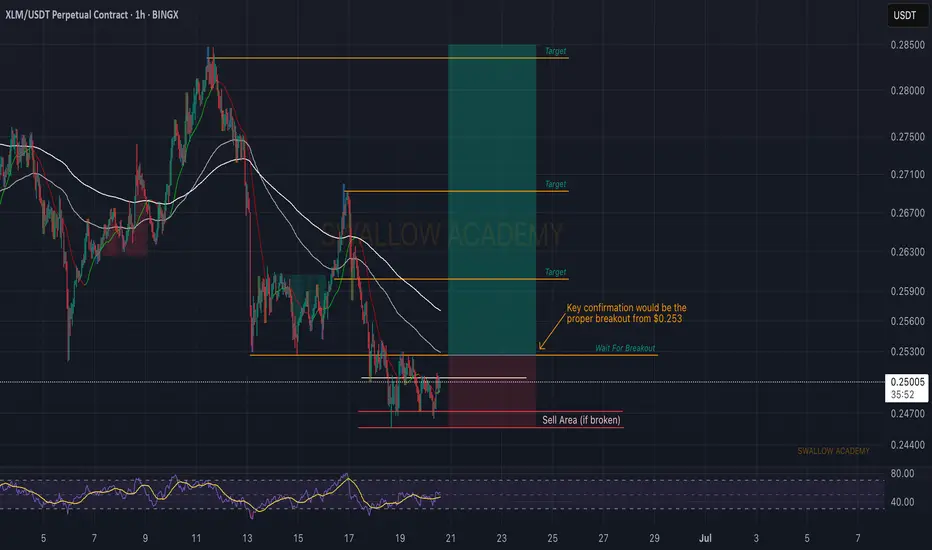
Stellar (XLM): Waiting For Breakout | Good Risk:RewardStellar coin is in an early stage for potential good upward movement from here. We see some kind of buyside volume forming here, which could give us a proper breakout, which we are waiting for.
As soon as we get it, we will be longing for $0.253.
Swallow Academy
XLM BREAKOUT DONE CAN IT GO ?XLMUSDT Long
📦 Entry Zone: $0.28025 (Marked on chart)
🎯 TP1:0.28841
🎯 TP2:0.3068
❌ SL: $0.26751
🧠 Strategy:
✅ Use low leverage
✅ Risk only 2–5% per trade
⚠️ Stick to the plan — no chasing trades.
Discipline = Consistency 💹
TuffyCalls Team

XLMUSDT Eyes on $0.3109: Breakout Zone Could Ignite Rapid ClimbXLMUSDT is currently forming a bullish reversal structure on the 4-hour chart. After a prolonged downtrend, price has established a support base around the $0.2570 level. This zone has acted as a key support, rejecting downside attempts multiple times, and creating a potential accumulation floor.
Th

XLMUSDT 1D#XLM — Major Breakout Ahead? 🔥
#XLM is moving inside a descending channel on the daily chart. It’s now approaching a key resistance cluster — made up of the channel resistance, the Ichimoku cloud, and the MA100.
If it successfully breaks above this zone, the next targets are:
🎯 $0.3509
🎯 $0.3909

XLM Break out ??Potential break out of falling wedge for XLM
Larger Volume on break a good sign, has retested breakout level.
needs to start moving higher and break that second consolidation zone or risks falling back into old patten.
what do you think? leave a comment.
XLM ,1DAs BTC is Falling And BTC is given Breakout of Pattern in 4Hr , then Remaining coins will also fall drastically .
in 1D pattern of XLMUSDT , it is Breaking Down as BTC is also given Break Down of Pattern
Follow for More Ideas like This

OMG!!! Strong Short Position for XLMUSDTEverything is clear on the chart. You can make 200% profit from this position by using 20x leverage. This is AMAZING. Don’t miss out on this opportunity!
Check out my previous analyses and be amazed =))))

$XLM is breaking out!CRYPTOCAP:XLM is breaking out! 🚀
After months inside a flag channel, CRYPTOCAP:XLM has finally broken the trendline with strength.
Now holding above $0.2880, this breakout could trigger a rally toward $0.6343, +128%.
Eyes on this move! 📈
DYRO, NFA

See all ideas
Summarizing what the indicators are suggesting.
Oscillators
Neutral
SellBuy
Strong sellStrong buy
Strong sellSellNeutralBuyStrong buy
Oscillators
Neutral
SellBuy
Strong sellStrong buy
Strong sellSellNeutralBuyStrong buy
Summary
Neutral
SellBuy
Strong sellStrong buy
Strong sellSellNeutralBuyStrong buy
Summary
Neutral
SellBuy
Strong sellStrong buy
Strong sellSellNeutralBuyStrong buy
Summary
Neutral
SellBuy
Strong sellStrong buy
Strong sellSellNeutralBuyStrong buy
Moving Averages
Neutral
SellBuy
Strong sellStrong buy
Strong sellSellNeutralBuyStrong buy
Moving Averages
Neutral
SellBuy
Strong sellStrong buy
Strong sellSellNeutralBuyStrong buy
Displays a symbol's price movements over previous years to identify recurring trends.
Frequently Asked Questions
The current price of STELLAR LUMENS/USD TETHER (XLM) is 0.2314 USDT — it has risen 1.73% in the past 24 hours. Try placing this info into the context by checking out what coins are also gaining and losing at the moment and seeing XLM price chart.
STELLAR LUMENS/USD TETHER price has fallen by −8.03% over the last week, its month performance shows a −14.26% decrease, and as for the last year, STELLAR LUMENS/USD TETHER has increased by 152.70%. See more dynamics on XLM price chart.
Keep track of coins' changes with our Crypto Coins Heatmap.
Keep track of coins' changes with our Crypto Coins Heatmap.
STELLAR LUMENS/USD TETHER (XLM) reached its highest price on Nov 24, 2024 — it amounted to 0.6362 USDT. Find more insights on the XLM price chart.
See the list of crypto gainers and choose what best fits your strategy.
See the list of crypto gainers and choose what best fits your strategy.
STELLAR LUMENS/USD TETHER (XLM) reached the lowest price of 0.0756 USDT on Aug 5, 2024. View more STELLAR LUMENS/USD TETHER dynamics on the price chart.
See the list of crypto losers to find unexpected opportunities.
See the list of crypto losers to find unexpected opportunities.
The safest choice when buying XLM is to go to a well-known crypto exchange. Some of the popular names are Binance, Coinbase, Kraken. But you'll have to find a reliable broker and create an account first. You can trade XLM right from TradingView charts — just choose a broker and connect to your account.
Crypto markets are famous for their volatility, so one should study all the available stats before adding crypto assets to their portfolio. Very often it's technical analysis that comes in handy. We prepared technical ratings for STELLAR LUMENS/USD TETHER (XLM): today its technical analysis shows the sell signal, and according to the 1 week rating XLM shows the sell signal. And you'd better dig deeper and study 1 month rating too — it's sell. Find inspiration in STELLAR LUMENS/USD TETHER trading ideas and keep track of what's moving crypto markets with our crypto news feed.
STELLAR LUMENS/USD TETHER (XLM) is just as reliable as any other crypto asset — this corner of the world market is highly volatile. Today, for instance, STELLAR LUMENS/USD TETHER is estimated as 4.06% volatile. The only thing it means is that you must prepare and examine all available information before making a decision. And if you're not sure about STELLAR LUMENS/USD TETHER, you can find more inspiration in our curated watchlists.
You can discuss STELLAR LUMENS/USD TETHER (XLM) with other users in our public chats, Minds or in the comments to Ideas.