Stellar 2025 Bull Market, ATH Targets, Price Action & MoreA very interesting chart. What is interesting here is how obvious it is that the correction is over. Stellar produced a massive bullish breakout in November 2024, more than 700% growth. After a strong move, there is always a correction. After the correction ends, we get the resumption of the initial move, in this case a bullish wave.
The 0.786 Fib. retracement level worked as support. 7-April. There is an interesting dynamic around this level. Back in July 2023 as XLMUSDT was rising resistance was found around 0.2000. Very close to this level. We then had the late 2024 bullish wave and the correction that ended in early April this year. Support was found exactly at the 0.786 Fib retracement level and this level matches 0.2000. This is the purple line on the chart. Resistance turned support.
After this support zone was hit and confirmed Stellar moved to produce an initial breakout and on the 16-June week, 22-June, we get a higher low. This higher low signals the start of the next bullish wave with a target around 0.9100. This is the next target for the current move but not necessarily where the bull market cycle will end. Can be but not necessarily, the action can move higher.
Growth potential from current price to our target goes to 257%. Coming from the August 2024 low, this same target would give a total of 1,099%. Seeing how strong the first jump was, it is likely that Stellar will go higher in this 2025 bull market.
We have another target between $1.25 and $1.35.
Let's focus on the market and the bigger picture.
Stellar has already proven that it will be a top performer in this cycle. Back in late 2024 XLM outperformed many projects, we can expect the same pattern to repeat in this bullish continuation.
The fact that there are no new lows also signals strength. We saw many pairs hitting new all-time lows in April and June, this is not the case here. And this is also good.
This is a proven project so it is easy to go in big.
Last time the meat of the move unraveled in just two weeks. Something also to keep in mind. Something similar would allow us to profit from the entire XLM wave and then browse the market for new opportunities.
Remember, the market is set to grow for 6 months in the least or it can extend and grow for years. While some pairs go down, others will be going up. When some pairs stop going up, others being down will recover and grow. The market will cycle between this and that, here and there; in the end, everything grows; that's the definition of a bull market. A rising wave lifts all boats.
Notice the long-term consolidation phase, it lasted more than 900 days and then we had a very strong bullish breakout. The longer the consolidation phase, the stronger the move that follows. This is only the beginning, there will be more.
Thank you for reading and for your continued support.
Namaste.
XLMUSDT trade ideas

XLM Stellar - Classic Lesson 15 said Long Lesson 15 methodology (annotations in sync with the chart):
1. Support (this where buyers can come in)
2. Largest dn volume wave after a while - Look left - buyers came in previously at the same location.
3. Placed AVWAP and waited for price to cross upwards and pullback again on AVWAP
4. Entry signal PRL with abnormal SI 11.2 (price has a hard time to move down - absorption) after the pullback and that's our entry.
Enjoy!

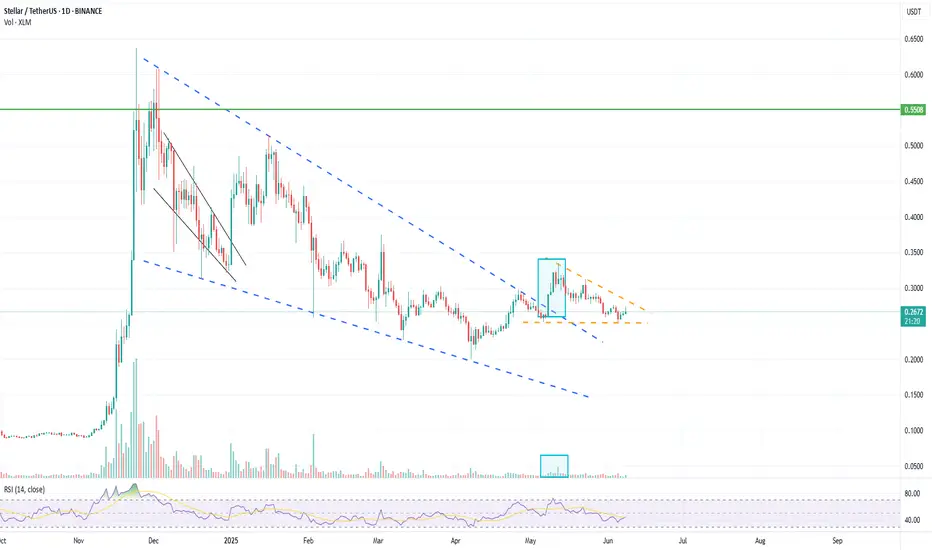
Stellar (XLM) Price Analysis - Potential Breakout ScenarioThis chart provides a technical analysis of Stellar (XLM) against Tether (USDT) on a daily timeframe, highlighting a potential breakout scenario. The price has been trending downward, approaching a key support area. The green arrow indicates a possible upward movement if a confirmed low is established below the highlighted zone. Key levels to watch include the support at around 0.2396 and the resistance trendline. Analysis conducted on TradingView as of July 06, 2025, 10:33 AM BST.

XLM Stellar Long Closed on 2nd ResistanceBased on previous entry explanation posts
Trade was closed with nice profit on second resistance which happen to touch it right on US non Farm news.
Enjoy!

XLM Stellar - Lesson 15 did the jobBased on previous idea explaining the entry Long.
I have moved stop to profit and we have two Resistance levels to surpass or not. According to the details on this levels I will close or let it run.

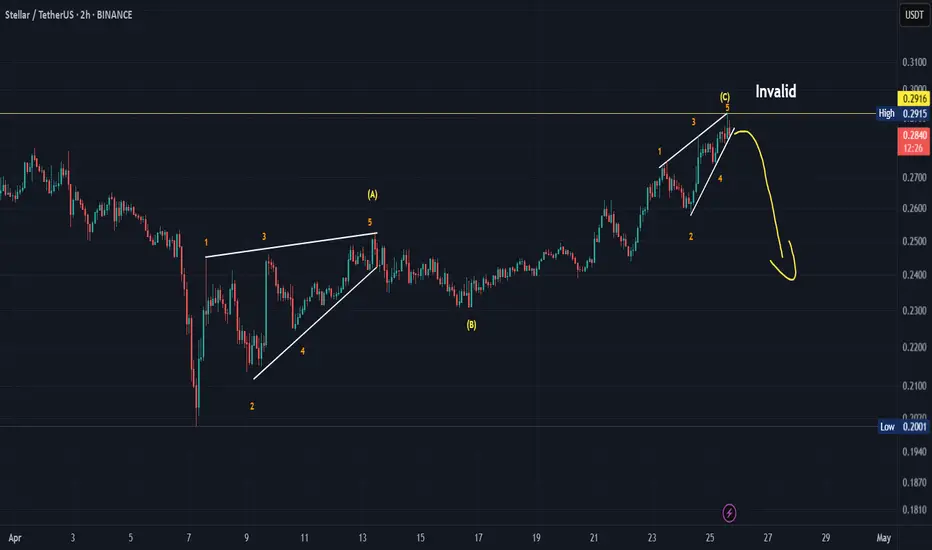
Coming down!I see three corrective waves in front of me that have been completed and concluded with an ending diagonal pattern. Please be careful of the possible upcoming decline.
*In principle, I am not a supporter of any direction, but I am only giving my point of view, which may be right or wrong. If the analysis helps you, then this is for you. If you do not like this analysis, there is no problem. Just ignore it. My goal is to spread the benefit. I am not one of the founders of the currency.
XLM Breakout Alert – Hidden Gem About to Explode?XLM/USDT is showing signs of a potential breakout from a long-term descending trendline that has been in play since November 2024. Price recently rebounded from a key demand zone (highlighted in yellow), suggesting strong buying interest at lower levels.
📉 Descending Trendline Resistance
The pair has consistently respected a strong downward trendline, rejecting all breakout attempts—until now. Price action is tightening near the apex, increasing the probability of an upward breakout.
🟨 Key Demand Zone
The $0.2150 - $0.2410 area has proven to be a strong accumulation zone, providing a solid foundation for a potential reversal. Price has shown multiple bullish reactions from this area.
📈 Upside Targets Upon Breakout Confirmation: If a confirmed breakout occurs, the following resistance levels can serve as potential profit-taking targets:
$0.2573 (breakout confirmation zone)
$0.3040
$0.3512
$0.4903
$0.5603
📌 Ideal Scenario:
Potential long entry after a confirmed breakout and retest of the trendline (~$0.25 - $0.26)
Stop loss below the demand zone (~$0.2150)
Attractive risk-to-reward setup with minimum 30% upside potential.
⚠️ Note: Wait for confirmation before entering the trade. Be cautious of false breakouts, especially under high market volatility conditions.

Stellar (XLM): Possible Buying Opportunity | Price Near SupportStellar coin has been forming some sort of bullish trend, where price has reached the lower side of that trend where buyers took over the area.
Now we are looking for that same momentum to continue and break the EMAs, which would then lead the price towards the upper side of the bullish trend.
Swallow Academy

xlmusdt trading opportunityXLMUSDT has exhibited a breakout from a falling wedge formation, the price is anticipated to perpetuate its antecedent bullish trajectory.
We have demarcated a specific zone on the chart that we refer to as the 'bull important zone.' This region is earmarked for its potential as an accumulation zone. The rationale behind selecting this area is grounded in its historical significance where the price has found robust support, thus offering an attractive risk-reward ratio for long entries.
Risk management protocols dictate that a stop loss be judiciously placed below the recent all-time low (ATL) at approximately $0.0703 to safeguard against unforeseen bearish reversals and to preserve capital.
The proximate objective for this trading setup is delineated as the 'immediate setup target' on our chart.
We greatly value your active participation and feedback on our analysis. Your likes are the motivation that sustains our commitment to providing insightful market analysis.
Thank you for your engagement and support.

Phemex Analysis #95: Pro Tips for Trading Stellar (XLM)Stellar ( PHEMEX:XLMUSDT.P ) is an open-source, decentralized blockchain platform specializing in fast, affordable cross-border transactions aimed at enhancing global financial inclusion. Its native cryptocurrency, Lumens (XLM), serves as a bridge for currency exchanges and is used to pay transaction fees on the network. Founded in 2014 by Jed McCaleb, Stellar connects banks, payment systems, and individuals worldwide, providing seamless and cost-effective financial interactions.
Recently, Stellar has shown positive market momentum, including a notable 5% price surge coupled with increased transaction volumes. A key catalyst for this optimism is PayPal’s upcoming integration of its stablecoin PYUSD onto the Stellar blockchain, significantly expanding Stellar's real-world use case and accessibility across more than 170 countries.
Given these promising developments, let’s explore several possible trading scenarios to help traders strategically approach XLM.
Possible Scenarios
1. Breakout Rise to $0.28 and Above (Bullish Scenario)
On the daily chart, XLM recently formed a clear "cup and handle" pattern, with the handle emerging around June 22. This classic bullish indicator signals accumulation of buying momentum. If XLM decisively breaks out above the critical resistance level at $0.257, particularly with strong trading volume, it could confirm a bullish continuation, potentially targeting resistance zones around $0.28, $0.312, and even the significant resistance at $0.43.
Pro Tips:
Entry Point: Consider entering positions after confirming the breakout above $0.257, ideally with significant volume confirmation.
Profit-Taking Levels: Aim to take partial profits at key resistance levels: $0.28, $0.312, and $0.43.
2. Rejection by Key Resistance Levels (Neutral Scenario)
While the immediate resistance at $0.28 is relatively weak and likely to be overcome easily, subsequent resistance at $0.312 and particularly at $0.43 could present strong selling pressure, potentially rejecting XLM’s first attempt.
If rejection occurs, the price will likely retrace to retest support zones, such as around $0.25, consolidating before attempting another bullish move.
Pro Tips:
Cautious Entries: If initial rejections occur at higher resistance zones ($0.312 or $0.43), consider waiting for price stabilization around lower support areas ($0.25) before re-entering.
Volume Check: Closely monitor trading volumes during retracements—declining volume often indicates a healthy pullback rather than a significant reversal.
3. All Things Go South (Bearish Scenario)
If broader market sentiment suddenly turns sharply negative—particularly driven by a significant decline in Bitcoin—XLM could face substantial selling pressure. A sharp drop below key support at $0.216 with high volume, accompanied by broader market downturns, would signal serious bearish momentum.
Pro Tips:
Market Observation: Stay cautious and consider stepping aside until clear stabilization occurs at lower support levels.
Accumulation Opportunities: Long-term holders should watch closely for stabilization at critical historical supports, including $0.20, $0.18, $0.12, and $0.09, which could offer attractive entry points for gradual accumulation.
Conclusion
Stellar (XLM) currently stands at a pivotal juncture driven by significant fundamental catalysts and compelling technical signals. By closely monitoring the outlined bullish, neutral, and bearish scenarios, traders can strategically position themselves for profitable trades while effectively managing risks. Always remain alert, employ disciplined risk management strategies, and stay informed on broader market movements to successfully navigate XLM’s market dynamics.
🔥 Tips:
Armed Your Trading Arsenal with advanced tools like multiple watchlists, basket orders, and real-time strategy adjustments at Phemex. Our USDT-based scaled orders give you precise control over your risk, while iceberg orders provide stealthy execution.
Disclaimer: This is NOT financial or investment advice. Please conduct your own research (DYOR). Phemex is not responsible, directly or indirectly, for any damage or loss incurred or claimed to be caused by or in association with the use of or reliance on any content, goods, or services mentioned in this article.

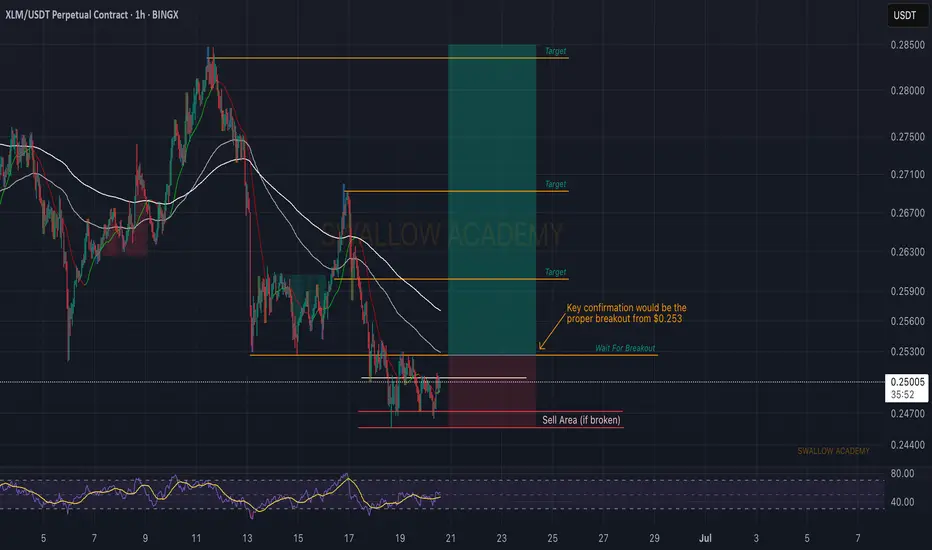
Stellar (XLM): Waiting For Breakout | Good Risk:RewardStellar coin is in an early stage for potential good upward movement from here. We see some kind of buyside volume forming here, which could give us a proper breakout, which we are waiting for.
As soon as we get it, we will be longing for $0.253.
Swallow Academy
XLM BREAKOUT DONE CAN IT GO ?XLMUSDT Long
📦 Entry Zone: $0.28025 (Marked on chart)
🎯 TP1:0.28841
🎯 TP2:0.3068
❌ SL: $0.26751
🧠 Strategy:
✅ Use low leverage
✅ Risk only 2–5% per trade
⚠️ Stick to the plan — no chasing trades.
Discipline = Consistency 💹
TuffyCalls Team

XLMUSDT Eyes on $0.3109: Breakout Zone Could Ignite Rapid ClimbXLMUSDT is currently forming a bullish reversal structure on the 4-hour chart. After a prolonged downtrend, price has established a support base around the $0.2570 level. This zone has acted as a key support, rejecting downside attempts multiple times, and creating a potential accumulation floor.
The price is now pushing above short-term consolidation, hinting at a possible breakout from the recent range. This range behavior, followed by an early higher low formation, indicates that buyers may be stepping in more aggressively.
Support Zone
The support zone around $0.2570 to $0.2585 is structurally significant. Price dipped into this level twice and was strongly rejected both times. The most recent low around this zone created a long wick, suggesting liquidity grab and potential trend reversal.
This zone now serves as a clear invalidation point for the bullish setup. A break below would likely invalidate the long bias and open the door for a deeper retracement.
Resistance Levels and Take-Profit Targets
The chart identifies two major resistance levels.
The first resistance is around $0.2902, marking Take Profit 1 (TP1). This level acted as resistance multiple times in the past and should be the first area where selling pressure could return.
The second resistance, marked at $0.3109 (TP2), is a higher timeframe resistance zone. It was previously a strong ceiling before the drop in early June. If the momentum is sustained, this area becomes a logical final target for the current bullish swing.
Supertrend Confirmation
The Supertrend indicator has recently flipped green, supporting the bullish bias. The flip occurred after price reclaimed the mid-range, and the price is now consolidating just above the Supertrend baseline.
This is a classic bullish signal on the 4H chart, particularly when it aligns with a structural bottoming pattern and a clean risk-reward setup.
Risk–Reward Setup
The current setup offers a favorable risk-to-reward ratio of 2.49. Entry is positioned near $0.2723, with the stop-loss placed just below the support zone at $0.2570. This limits downside risk to approximately 5.6%.
The upside, on the other hand, stretches up to $0.3109, offering potential gains of around 14%. Even the first target at $0.2902 offers a decent 6.5% return, making this trade attractive for swing traders aiming for a mid-term move.
Momentum Shift and Potential Breakout
What strengthens the bullish case further is the price action attempting to break out of the recent lower high zone. There is a clear effort to reclaim momentum, and a successful 4H candle close above $0.2770 would signal a clean breakout and continuation.
Earlier price action shows signs of accumulation, including a liquidity sweep below $0.2570 followed by strong rejection — a common reversal pattern in crypto markets.

XLMUSDT 1D#XLM — Major Breakout Ahead? 🔥
#XLM is moving inside a descending channel on the daily chart. It’s now approaching a key resistance cluster — made up of the channel resistance, the Ichimoku cloud, and the MA100.
If it successfully breaks above this zone, the next targets are:
🎯 $0.3509
🎯 $0.3909
🎯 $0.4309
🎯 $0.4880
⚠️ Always use a tight stop-loss to manage risk and protect your capital.

XLM Break out ??Potential break out of falling wedge for XLM
Larger Volume on break a good sign, has retested breakout level.
needs to start moving higher and break that second consolidation zone or risks falling back into old patten.
what do you think? leave a comment.
XLM ,1DAs BTC is Falling And BTC is given Breakout of Pattern in 4Hr , then Remaining coins will also fall drastically .
in 1D pattern of XLMUSDT , it is Breaking Down as BTC is also given Break Down of Pattern
Follow for More Ideas like This

OMG!!! Strong Short Position for XLMUSDTEverything is clear on the chart. You can make 200% profit from this position by using 20x leverage. This is AMAZING. Don’t miss out on this opportunity!
Check out my previous analyses and be amazed =))))

$XLM is breaking out!CRYPTOCAP:XLM is breaking out! 🚀
After months inside a flag channel, CRYPTOCAP:XLM has finally broken the trendline with strength.
Now holding above $0.2880, this breakout could trigger a rally toward $0.6343, +128%.
Eyes on this move! 📈
DYRO, NFA

Stellar (XLM): Huge CME Gap SpottedStellar still has that big CME gap that needs to be filled before we see another movement to upper zones
So far, after topping, the price has been falling steadily and we are looking for similar calm movement to happen and once we approach the CME, we are expecting some volatility candles to form there.
Swallow Academy

XLMUSDT, 1HrPattern is looking Good , If BTC is Sustaining Above 1,06,834 this level then , This XLM pattern will Give a Good Breakout ,
Enter only When Upper Trendline is Breakout
Take Your Own Risk According to your Capital .
Follow for More Ideas Like This

XLMUSDT → Consolidation above 0.300 will provide an opportunityBINANCE:XLMUSDT.P is returning to the buying zone relative to strong resistance as part of a local uptrend. The market backdrop is favorable, but Bitcoin poses risks...
Bitcoin is updating its historical high and continuing its bullish trend, which is a favorable backdrop for altcoin growth. However, risks are posed by the fact that BTC may form a false breakout of resistance, which would trigger a correction across the entire market.
XLMUSDT is returning to the buying zone relative to strong resistance as part of a local uptrend.
If the bulls hold their ground above 0.3000, growth may continue in the short and medium term.
Resistance levels: 0.318, 0.324
Support levels: 0.300, 0.2975, 0.2799
The focus is on 0.3000, which is a fairly important and key (psychological) level. If the bulls manage to hold their ground above this point, the price will continue to rise, but it is necessary to monitor the behavior of the bitcoin.
Best regards, R. Linda!

From Compression to Expansion: XLM Eyes 100% Move After BreakoutStellar Lumens BINANCE:XLMUSDT has emerged from a prolonged consolidation within a descending wedge pattern, delivering a potentially bullish breakout on the daily chart. This technical development could mark a significant turning point.
Technical Structure: The Descending Wedge
The descending wedge is a bullish reversal pattern that forms when the price action creates lower highs and lower lows within two converging trendlines. Since late 2024, XLM has traded within such a structure, slowly compressing in volatility as the apex of the wedge approached. This formation reflects a decline in bearish momentum and hints at an eventual upward resolution, precisely what occurred in early May 2025.
The breakout above the upper trendline of the wedge is a significant technical signal, suggesting a shift from distribution to accumulation. Breakouts from descending wedges often lead to sharp, directional moves as sidelined buyers regain confidence.
EMA Confluence and Confirmation:
Adding strength to this setup is the reclaim of the 100-day EMA, currently sitting around $0.2872. The EMA had acted as dynamic resistance during the wedge formation, with multiple failed breakout attempts earlier this year. The successful break and hold above this level now signal a potential trend reversal, reinforcing the bullish breakout.
The price is currently consolidating above the 100 EMA, creating a new base of support. If this level holds, it could serve as a launchpad for further upside movement in the days and weeks ahead.
Key Levels and Trade Context:
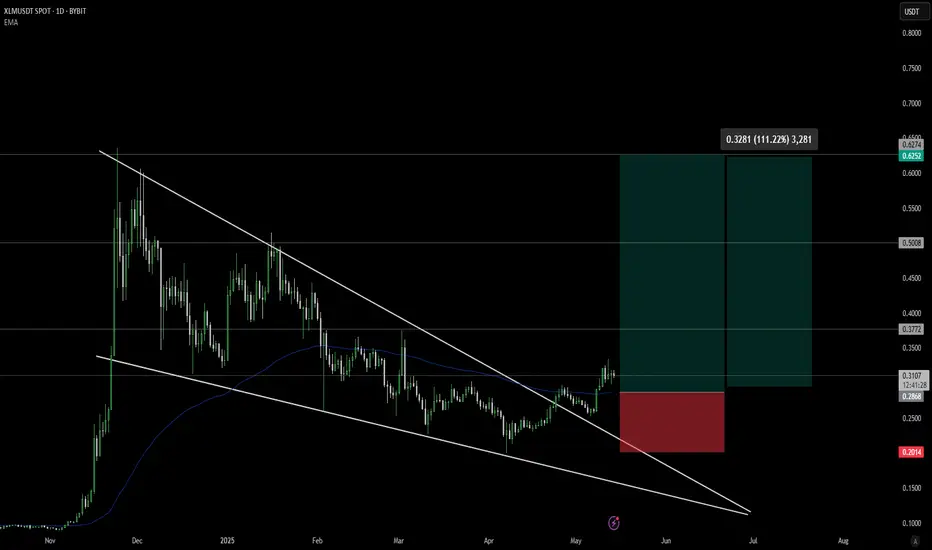
Immediate resistance lies at $0.3772, which aligns with previous structure highs and horizontal supply zones. Beyond this, higher resistance targets are marked at $0.5008 and $0.6252—each corresponding to major levels from prior cycles.
On the downside, the invalidation point sits clearly below the wedge and the EMA at $0.2014. This makes risk management straightforward for traders, with stops logically placed beneath this key level. The defined support zone gives the trade setup a favorable risk-to-reward profile, offering more than 2:1 reward relative to risk if targeting the first resistance alone.
Pattern Implications and Measured Move:
The measured move from a descending wedge is typically equal to the maximum height of the pattern, added to the breakout point. Based on this metric, a breakout from the $0.31 zone could yield a target close to or even above the $0.60 level, aligning with historical resistance.
This makes the potential upside around 100% or more from current levels, highlighting the value of participating in such early trend reversals when confirmed by multiple technical factors.
Educational Takeaway:
This setup provides an excellent educational case study for traders seeking to improve their pattern recognition skills. The descending wedge is one of the more reliable reversal patterns, especially when paired with additional confirmation such as EMA reclaim, strong volume surges, or bullish candlestick structure at the breakout point.
Understanding the importance of confirmation—rather than anticipation—can greatly improve trade outcomes. This chart also illustrates how structure, trend, and timing come together to create asymmetric opportunities in the crypto market.
Conclusion:
The breakout in XLM/USDT marks a decisive shift in market structure and momentum. The combination of descending wedge resolution, 100 EMA reclaim, and a clearly defined trade setup makes this chart technically attractive. Traders should monitor continuation patterns and volume closely to gauge the strength of the trend, while investors may consider this a signal that the longer-term bottom could be forming.
As market sentiment across altcoins improves, CRYPTOCAP:XLM 's current technical posture positions it as a prime candidate for outsized gains. Whether you're actively trading or looking for longer-term entries, XLM deserves a spot on your watchlist in the weeks ahead.
XLMUSDT 1D AnalysisXLM ~ 1D Analysis
#XLM Buy gradually from here if you still have confidence in this coin with a short term target of at least 10%+ from here.
