Can XLM hit $1 this year? Let's find out!The Stellar price has recorded a strong bullish recovery around its $0.43 mark. By hovering close to that psychological barrier since the week started, this altcoin has formed a resistance/support level around the price range. This further makes it a crucial watch level.
Specifically, with an intraday surge of over 14% with a trading volume of $4.233 billion, the Stellar price has reclaimed the $0.50 mark. Moreover, with the recent bullish candle, this altcoin has formed a flag pattern in the 1D time frame, suggesting a significant increase in the price action.
The Relative Strength Index (RSI) continues hovering above the overbought range in the daily time frame. This highlights an increase in the buying-over-selling pressure for the altcoin in the crypto market.
Further, the EMA 50/200-day has displayed a constant uptrend after experiencing a Golden Cross earlier this month. This suggests that the altcoin may continue gaining value in the upcoming time.
If the bullish sentiment sustains, the XLM coin price will breach its important resistance level of $0.50 and head toward its upper high of $0.60. Maintaining the price above that level could set the stage for this altcoin to retest its upper high of $0.70.
Conversely, if the bears outrun the bulls, the Stellar token will retest its support trendline of the flag pattern. Furthermore, if the bears dominate the crypto space, this could result in it plunging toward its lower support level of $0.40.
XLMUSDT trade ideas

XLMUSD - 15 JAN 2023 pump?
the photo is taken from the stellar tweeter, I did a little analysis and a little attentiveness.
This does not mean that it is after this time stamp that there will be a pump, but considering what tips are left and where we have the main POS dialing area. There will be a reversal with a high degree of probability, squeezes are not excluded. Set zone 0.69 and 0.6699


XLM and the potential 560 Risk to reward Opportunity Hi Everyone;
today we have one of the best risk to reward Investment opportunity
it is more than 560 times the risk and the chart is look very promising.
I expect breaking the previous bear market key point will clear the way to the final target

Long opportunity in XLM/USDTIf breaks the level 0.51043 with a 15 Min Green candle, there is an opportunity for long trade.
And wait to retest the same level.
Disclaimer : I'm not recommending to take this entry. Do with your analysis too.
Reasons : -
. Trend line breakout.
. A major Resistance level breakout.
. Inverse head and shoulders pattern.
. Falling wedge pattern.
After Breakout :-
Entry : 0.51043
TP : 0.54816
SL : 0.48608

Stellar (XLM) up 69%, ATH draws closer – brief analysisStellar (XLM) has been steadily gaining momentum in recent days, currently trading at $0.52 — a 127% increase over the past week.
XLM is currently trading just below a key resistance level at $0.58. Breaking through this critical price point could pave the way for a surge to $0.71. Sustained buying momentum at this level may position XLM to reclaim its all-time high of $0.91.
Furthermore, readings from its Average Directional Index (ADX) confirm this bullish outlook. As of this writing, XLM’s ADX is in an upward trend at 68.945.
Also, XLM’s rising open interest indicates heightened market activity and confirms strong investor confidence. On Saturday, the token’s open interest climbed to an all-time high of $291 million.
However, if buyer exhaustion sets in, XLM’s price will fall toward support at $0.47, invalidating this bullish outlook.

XLMXLM broke out from almost two years of consolidation. Generally I would like for the retrace significantly before I set my buy limits.

XlmusdtDoing a scalp trade here at the 50% fib retracement rsi getting very oversold in the short timeframes . It has lost nearly 30% from peak I think it’s a good trading enter area .

ANOTHER SPECULATIONDon’t hate me. I’m just speculating. I shared a post about this ascending channel before. Looks like price is resisting the top of this ascending channel. I plan to buy the midline, if price ever goes to those levels, but I’m also kind of not sure if price will tear through the top of the channel or head back down to the midline to find support there. Anyway, I play with parallel channels a lot, they’re a good toy to play with. Remember, this is just a speculation. If you wait for 23-25 cents and price never reaches these levels, it’s on you. do your research and share your ideas on TradingView so I and everyone else can learn from you.

JUST SPECULATINGThis is just a speculation, so don’t get mad. I have no real evidence to back up this scenario. I’m just playing with Fibonacci levels and the 0.5 fib level is taking us back to the 23-25 cents, where price resisted first but then found support and broke out of that level. Would be a nice price to buy for those who missed the rally, but I’m really not sure if we will ever see these low prices again. As I said I’m just speculating and playing with fib retracement levels. DYOR…

Steller lumens 700% extension in 2024On the above 10 day chart price action has corrected 90% since May 2021. Will the correction continue? Unlikely. Why?
1) Price action and RSI resistance breakouts.
2) Regular bullish divergence.
3) Bull flag confirms support on past resistance. Notice the bullish engulfing candle?
4) The forecast is made from the first impulsive move. A 2nd impulsive move from the confirmation of support will see price action print to the 70 cent area.
Is it possible price action continues to correct? Sure.
Is it probable? No.
Ww
Type: Trade
Risk: You decide
Timeframe for long: Before the end of month
Return: 70 cents / 700%

XLM Weekend Correction Bull Flag will Form? XLM Weekend Correction Bull Flag will Form?
Stellar rose like a star. Now it needs to cool off. RSI hit 90+. Coming down now.
Possible entry: $0.37-$0.45
This information is not financial advice. Do your own research.

Xlmusdt So the rsi is at 94 on the daily weekly is at 92 , never in Xlm history the rsi been so high on the daily . Can it continue higher yes but late buyers will get punished here . I it has done 5x Already , I don’t own Xlm just I can care less if it continues higher just poiting the rsi out that is crazy high

XLMUSDT (StellarLumens) Updated till 23-11-24XLMUSDT (StellarLumens) Daily timeframe range. we can see a insane continuous retrace back here. huge gains made by traders. with this volume a valid close over 0.4250 can send it to 0.5733 or above. recent support at 0.2986.

XLM SHORTThe chart highlights a significant fractal pattern observed in XLM/USDT on the weekly timeframe. Historically, these fractals indicate periods of sharp price rallies followed by equally steep corrections. The current price action aligns with this repetitive fractal behavior, suggesting an imminent decline.
Key Observations:
Resistance Zone:
The price has approached a critical resistance level (marked by the yellow horizontal line), coinciding with prior fractal tops.
Bearish Signal:
The chart marks a "Perfect Fractal for Short," emphasizing historical patterns where price rejected from similar levels, leading to steep declines.
Target:
A short trade is projected with a target of 0.1 USDT, reflecting a substantial downside potential based on historical fractal patterns.
Volume Spike:
Recent volume surges signal a possible climax of buying interest, often preceding significant corrections.

Long opportunity in XLM/USDTIf breaks the level 0.24137 with 15 Min Green Candle, There is an opportunity for long. And you need to wait to retest the same level.. This is my analysis, i'am not recommending to take this entry. Do with your analysis too.
Reasons:-
.Buyers volume increasing.
.Trend line breakout.
.200 EMA Support.
.BTC in bullish trend.
After breakout :-
Entry - 0.24137
TP - 0.25473
SL - 0.23278

Stellar XLM price has finally reached TP1, where to next?Only 5 months (and for some, several years) and we finally waited for the price of CRYPTOCAP:XLM to rise.
1️⃣st target for 2024 from our previous idea has been reached, which is +150%.
Now, the main task of OKX:XLMUSDT buyers is to keep the price above $0.195
If this condition is met, the #Stellar price can go straight to fulfill the target 2️⃣, but already in 2025 it will be $0.64 - 0.65
_____________________
Did you like our analysis? Leave a comment, like, and follow to get more

Xlm / UsdtBINANCE:XLMUSDT
📉 Current Price: 0.2483
🔧 Support Levels: 0.1973 / 0.1200
🔄 Trap Pattern Alert: The price sometimes forms trap patterns—fake breakouts or reversals—which could indicate a sudden price shift.
💭 Things to Watch:
🛠️ If price stays above support (0.1973 / 0.1200), a bounce or upward move could be possible.
⚠️ If price breaks support, downside risk may increase.
🔒 Reminder: Not financial advice! Always do your own research before making decisions! 🧠💡

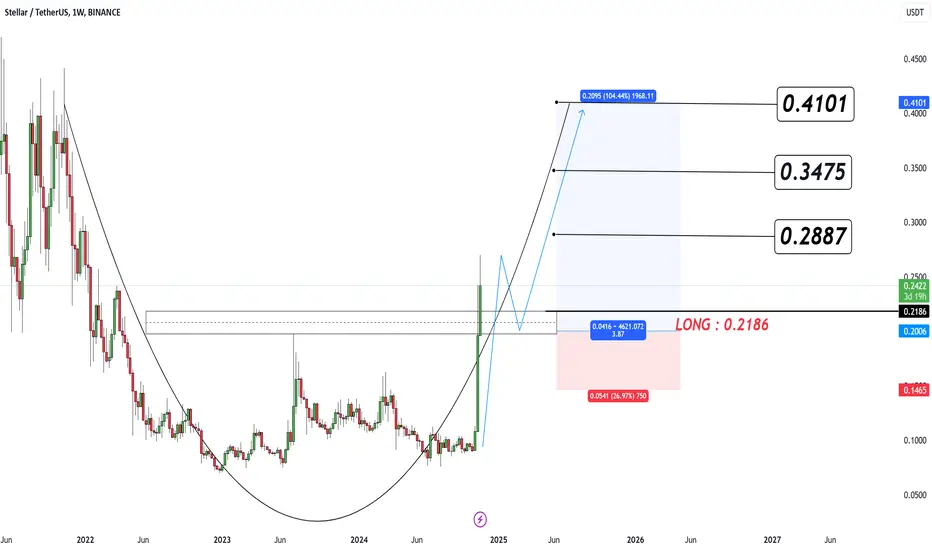
The technical analysis of Stellar (XLM)The technical analysis of Stellar (XLM)
The current price is approaching a crucial support level at $0.2186, making it an optimal zone for buying if the bullish momentum continues.
Target Levels:
First Target: $0.2887
Second Target: $0.3475
Main Target: $0.4101
Enter buy positions at the current level or on a slight pullback toward the support area at $0.2186.
Place a stop-loss below $0.2006 to manage risk.
XLMUSDT 4h time frame - shorthi traders.
I'm calling the top on XLMUSDT on the 4h time frame.
Bearish divergences are present and the price seems to be very overextended already.
MACD hasn't given us a bearish cross yet but bearish divergences on MACD are present as well.
Not gonna continue this pump without the healthy pullback!
See you lower soon!

Alt coins ready to run ANKR, BAT, LINK, RNDR, DOT, LTC, LRC, ETCThis market is great for trading trend lines, look at this chart as an example, the two thick dark purple likes. The short one represented resistance for about 5 months, we finally broke that resistance and we broke out, we ran to top of what had been resistance for about 18 months, we had a small hiccup in both places and the break out from that trend line lead to XLM running virally, up to 65% in one day.
Every day there are may assets reaching towards a break out point, and that's what I try to look for. I start on 1 day charts and then come down to a 4h or 1h candle, really no since in going to a shorter candle unless you are looking for precision entry. The main thing to take away from this is that when an asst breaks a resistance it tends to run, many times first coming down and proving that line to be support instead of resistance, then taking off, sin any case, the break of a trend line is generally a fuse lit for a run. The longer the resistance, the more times its resisted and then it breaks out, the break out tends to be stronger.
Here are some alts i have been watching that seem to be staging breakouts or possibly in an early stage of the breakout.
I like ENJ, ANKR, BAT, LINK, RNDR, DOT, 1INCH, mostly these are midcap, but they have started to break out from recent trends.
I kind of like LTC, LRC, ETC, ATOM, BNT, MASK, MPL. Higher risk, but they have staged a breakout and most of these have lower marketcap so easier for them to get pushed further.
Lots of other coins nearing some breakout points as well, they seem to be coming in waves with each day throwing us some 20,50, even 100% gains some times.
I will try to post another update of break outs soon but in between all the trading and working to try to make my ai tech startup do something, my time is short. That also can lead me to evaluate things too quickly sometimes so don't just take what I say as a trigger to pull, use it as a flag to get your interest in evaluating these things yourself.
The market is very bullish right now and there is a lot of opportunity to make nice gains and also to lose a lot buying the dead end of a recent run. Be vigilant.

$XMR Same movement $XLMOMXSTO:XMR Same movement CRYPTOCAP:XLM
Pattern: Symmetrical triangle breakout is anticipated.
Key Levels:
Support Zone: $153.46 (current level).
Target 1 (T1): $301.01
Target 2 (T2): $389.30
Target 3 (T3): $495.44
