Breakout?Breaking out of this hell hole deserves a celebration, if the market doesn’t act irrationally like always and price doesn’t go back into the descending channel.
XLMUSDT trade ideas

XLMUSDT IDEAUPDATE
Bullish Pennant Upside Breakout is Already Done in 3D Timeframe...
Expecting Bullish Wave📈
COIN DETAIL
Stellar (XLM) Price today is $0.1164, for the last 24 hours 464,416,141 XLM coins were exchanged with a trading volume of $54,047,253. It's currently traded on 66 exchanges. The price is down by (-0.05%) for the last 24 hours. It has a circulating supply of 28 billion XLM coins and is ranked #31 by current Stellar market cap of $3 billion.

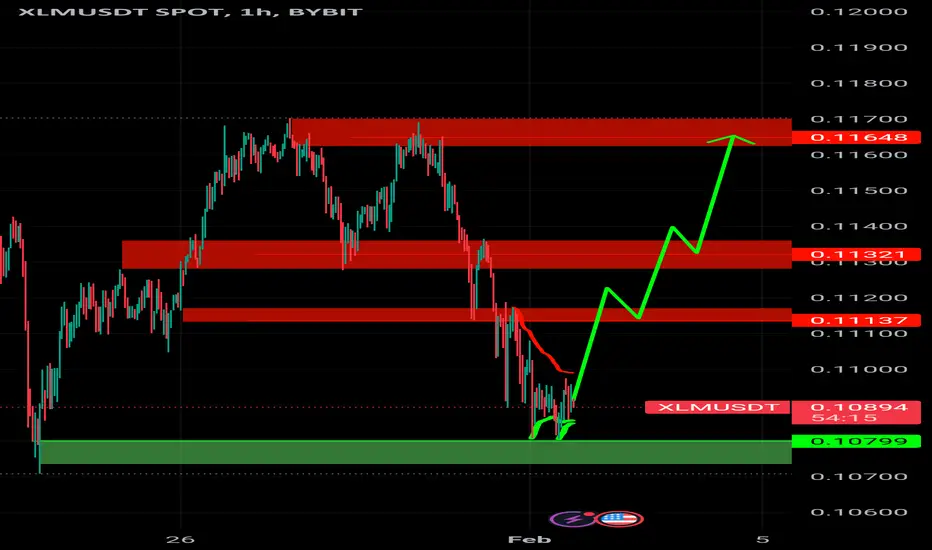
XLMUSDTHello dear friends
It seems that we can consider the possibility of forming a tangent head and shoulder with the support zone.
The above scenario is valid under the condition of maintaining the price range of $0.102.
What do you think?

REJECTIONYes, everyone's bullish on XLM, but maybe we have to break some resistance levels for the bulls to take over. so far, xlm does not have the strength break through all the resistance levels ahead of it. long term, i've been bullish for a long god damn time, but we need to see xlm break these levels if we want others to jump in.

XLMUSDTXLMUSDT is in strong bullish trend.
As the market is consistently printing new HHs and HLs.
currently the market is retracing a bit after last HH, which is 50% Fib retracement level and local support as well. if the market successfully sustain this bullish confluence the next leg high could go for new HH.
What you guys think of this idea?

XLM/USDT Bullish Momentum ready for back test on the key area!💎 XLM has recently shown significant market dynamics, with a successful bounce from the demand area.
💎 Currently, it is moving upwards towards the Bearish OB (Order Block) + supply area. If XLM manages to break out successfully upon reaching the supply area, following previous rejections, probability we may witness a substantial upward movement toward our target area.
💎 However, if XLM fails to break the supply area and experiences rejection once more, there's potential for the price to retreat downwards, possibly revisiting the demand area or even the Bullish OB area to gather momentum for a stronger breakout attempt at the supply area.
💎 The Bullish OB area holds significant importance, as a failure to bounce and a subsequent breakdown from this level could indicate bearish momentum, leading the price further downwards.

XLM Daily LongThere is a downtrend on the XLM daily chart that has retested successfully and formed an inverse head & shoulder pattern. The RSI has also bounced off a support level as well as tested a resistance line both coordinate to the trend and pattern analysis. I predict a bullish swing that will fill up to the top of the downtrend. The volume is also indicated a bullish movement while decreasing with a decreasing price.

Breakout will yield "Stellar" profit on XLM BINANCE:XLMUSDT (4H CHART) Technical Analysis Update
XLM is currently trading at $0.117 and the price is currently trading at its strong resistance zone which got rejected multiple time.
We are looking for a LONG trade opportunity if the price successfully breakouts from the resistance zone.
Successful breakout will push the price to next minor resistance which can be easily broken and our final target is next major resistance around 0.1386
Entry level: $0.1190 (Candle close above this)
Stop loss level: $ 0.1121
Target 1: $ 0.1220
Target 2: $ 0.1252
Target 3: $ 0.1318
Target 4: $0.1380
Max Leverage: 5x
Don't forget to keep stop loss.
Follow Our TradingView Account for More Technical Analysis Updates, | Like, Share and Comment Your thoughts.
Cheers
GreenCrypto

XlmusdtWe anticipate BTC to potentially reach the $23,700 level before a potential upward rally. If the support at $23,700 holds, there is a possibility of a 50% price increase from the Neck Line support, with a target of $36,000.

XLM ADAM AND EVE PATTERN: FULL CHART ANALYSIS.In this post, I'll tackle the pattern formed on BINANCE:XLMUSDT which is a bullish pattern, Adam and Eve. As of this writing, the price already reached the neckline, which is critical for deciding the next move. On the thread below, I'll provide what would be my approach for the coin through my technical chart analysis.

XLM can bring up to 44% profit.Hello everyone!
I believe we have a good opportunity to buy #XLM and earn up to 44% profit.
Entry at 0.236 Fib (0.1182$)
First target - 0.1529$
Second target - 0.1712$
This is not financial advice, everything you do, you do at your own risk!

#XLM #XLMUSDT #Analysis #ShortSetup #Wychoff #Distribution #Eddy#XLM #XLMUSDT #Analysis #ShortSetup #Wychoff #Distribution #Eddy
(("All the relevant areas and explanations on the chart are clear and clear, the trading setups need to get confirmation to enter, if you don't know how to get a trigger and confirm entering into transactions, this analysis is not suitable for you, the above analysis is for professionals. and if you are a beginner, my suggestion is that you don't destroy your capital and first learn technical analysis and basic trading along with psychology and risk and capital management from reputable sources and courses, and then enter the financial markets."))
(("The above analysis and setups and points and areas are combined with most of the combined styles such as price action, supply and demand, RTM, ICT and also with the analysis of important indicators such as Dominance Tether and Bitcoin.
If you are familiar with the mentioned styles and know how to get approval to enter the above styles, use the above analysis.
This is not an investment proposal and only my opinion, please act based on your experience and decisions."))
~~~~~~~~~~~~~~~~~~~~~~~~~~~~~~~~~~~~~~~~~~
I also suggest you to view my #Analysis of the Phases of Richard #Wyckoff #Accumulation & #Distribution on #Bitcoin #Currency from the link below :
#BTC #Bitcoin #Final #Update 'D' #Wychoff #Distribution #Eddy
Related Tether Market Cap USDT Dominance Analysis : (( USDT.D )) : Check Link :
~~~~~~~~~~~~~~~~~~~~~~~~~~~~~~~~~~~~~~~~~~
Analyses of Trading Ranges By : Dr. #Eddy SunShine 👨🏻💻 2/14/2024 ❤️

Nothing to see hereThere is absolutely nothing here to see. This is a simple trend analysis and it shows me that the price of stellar is very likely to take off from where it is.

An inverse head & shoulders pattern formed in XLM.Today was an incredible day for many cryptos, and not so much for others. But one thing you can be sure of is that XLM has been spending the past two weeks forming a perfect head & shoulders pattern on the 30 minute chart that, assuming it plays out bullishly, is almost near the take off point!
If price action breaks out of the dashed white line at the top of the wedge pattern, we could see a dramatic price increase in the coming weeks. This could also be a great sign that XLM could be well on its way to gaining ground, and starting a new bullish trend in the mid to long term.
Good luck, and always use a stop.

"Invest like Elon Musk, buy Stripe."What's one of the most profitable businesses you could do?
One of them would be payment processing.
Just look at the success of Square, Visa, Mastercard, PayPal, etc.
That's how Elon Musk got most of his capital to be able to start Tesla & SpaceX, by selling his PayPal shares.
But did you know that in 2011 Elon Musk invested in an upcoming payment processor called Stripe?
Stripe is today one the biggest online payment gateways, right behind PayPal.
But what could Stripe do in order to grow even more?
Make cross-border payments easier? Lower processing fees? Enable everyone to become their own bank?
One feasible way to do that would be via the usage of cryptocurrencies.
But which one would they be particularly interested in?
Well, you could probably guess if you are reading this 😃
The thing is that Stripe owns 2% of all XLM (Stellar) that exists.
stripe.com
This is significant, and the good part is that it doesn't seem like they have utilized it in any way yet.
But that's not the only thing that makes Stellar promising.
Here are some of their advisors:
- Patrick Collison (CEO of Stripe)
- Sam Altman (President of Y Combinator & Co-founder of OpenAI w/ Elon Musk)
- Naval Ravikant (Founder of AngelList)
- Matt Mullenweg (CEO of Automattic which owns WordPress & WooCommerce)
Stellar has IBM as a partner.
Stellar is supported by Keybase (owned by Zoom).
Balaji on "new kinds of value transfers":
twitter.com
And of course, if you didn't already know, it's one of the fastest cryptocurrencies with very low transaction fees.
It is not considered as a security like Ripple's XRP does.
It is also available to invest in via Grayscale (one of the largest digital currency investing authorities).
And to just add the cherry on top. They are working on bringing zero-knowledge smart contracts, which could be huge!
github.com
That could create the possibility of private stable currencies, DeFi, NFT, or whatever crazy crypto topics/projects people fancy 😂


FALLING WEDGEI really have no idea if we will go up or down at this point. i just spotted a falling wedge and it looks like price has broken out of the wedge. i would not claim that this is a bullish structure because all my bullish analyses have been wrong so just make your own conclusion and leave me out of it.

XLM inteligentassetbullish scenario
resistances 0.117 in 200&50 ema's, 0.1256 pivot high, 0.141 upper limit channel
bearish scenario
supports 0.107, 0.093 lower limit channel & horizontal

XLMUSDT pump starts from hereJust a combination analysis between harmonic and SMC
DYOR
not a financial advice
take your responsability
TPs and SL are clear
Good luck

XLM/USDT | Stellar | 1W 👀Stellar enables the creation, sending, and trading of digital representations of all forms of money: dollars, pesos, bitcoins, and anything else. It's designed to unite all financial systems worldwide within one network.
Monitoring. Awaiting target as planned. Risk per coin is no more than 1-2% of the portfolio. Cumulative risk is not more than 5%.
- Not financial advice, trade with caution.
✅ Stay updated on market news and developments that may influence the price of Stellar. Positive or negative news can significantly impact the cryptocurrency's value.
✅ Exercise patience and discipline when executing your trading plan. Avoid making impulsive decisions driven by emotions, and adhere to your strategy even during periods of market volatility.
✅ Remember that trading always involves risk, and there are no guarantees of profit. Conduct thorough research, analyze market conditions, and be prepared for various scenarios. Trade only with funds you can afford to lose and avoid excessive risk-taking.
#Crypto #Stellar #Investing #XLM

XLM signalXLM is going Upwards again after hittin the support zone all the TP's will be reached in few hours or maybe a day

XLM Bullish Scenario XLM Bullish Scenario
XLM Pullback from Support Zone.
Looks like bulls buying more.
Bullish power loading up
XLM will likely drop an additional 25% before it rebounds.XLM appears to be working its way to the bottom trend line of the wedge pattern that has formed on the daily chart. If it does, it will likely bounce, and make a run for the top trend line of the wedge pattern. This could present many opportunities for day/swing traders, and make it easier to determine entry and exit points if it plays out.
Good luck, and always use a stop.
