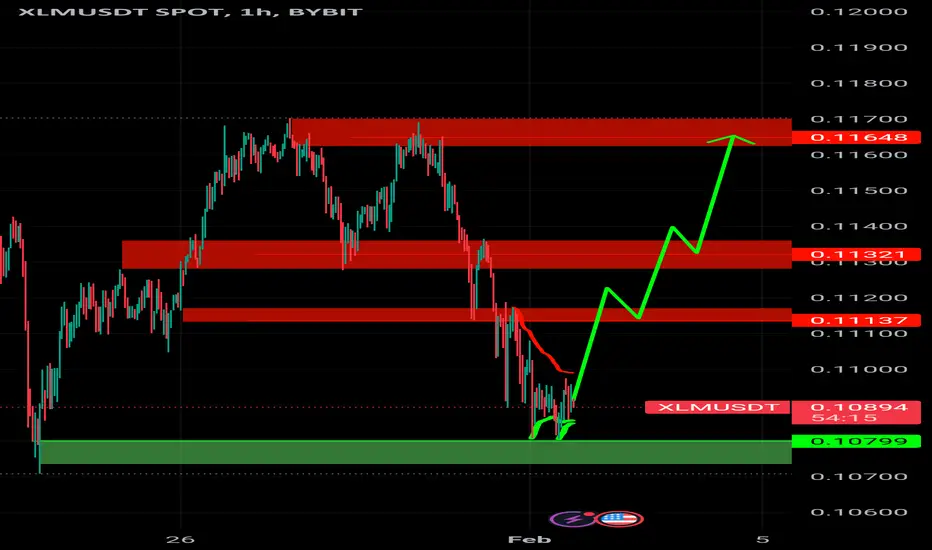
XLM signalXLM is going Upwards again after hittin the support zone all the TP's will be reached in few hours or maybe a day
XLMUSDT trade ideas

XLM Bullish Scenario XLM Bullish Scenario
XLM Pullback from Support Zone.
Looks like bulls buying more.
Bullish power loading up
XLM will likely drop an additional 25% before it rebounds.XLM appears to be working its way to the bottom trend line of the wedge pattern that has formed on the daily chart. If it does, it will likely bounce, and make a run for the top trend line of the wedge pattern. This could present many opportunities for day/swing traders, and make it easier to determine entry and exit points if it plays out.
Good luck, and always use a stop.

Falling Wedge with potentialTraders, get ready to dive into a chart setup that could lead to some gains! 🚀📊 We've identified a compelling falling wedge pattern on XLMUSDT.P (4H) and it's time to dissect the potential opportunities this pattern presents.
This tightening price range signifies a gradual decrease in selling pressure, potentially leading to a bullish reversal.
We can identify potential entry points near the support trendline. This presents an advantageous risk-reward ratio as the wedge's narrowing range suggests diminishing downside potential. Traders may consider setting their sights on targets based on key price levels or Fibonacci retracement levels.
Disclaimer: This post is for educational and informational purposes only and should not be considered as financial advice. Trading carries risks, and it's important to conduct thorough research and consult with financial professionals before making any trading decisions.

PredictionS for XLM.Hello everyone.
All the numbers on the chart : the Entry , Take profit areas and Stop loss are specified.
It seems that the price indicated by the star symbol will be touched before the price indicated by the no entry sign. wait for entry

XLM is ready to fly for a new ATHXLM is about to enter an uptrend phase after a long time of consolidation. These BBs suggest that the uptrend is getting closer as they squeeze tighter.

XLMUSDT # 001 ( 2000% Growth with 2024 Market surge $$$ ) Hello dear traders.
Good days .
First of all thanks for your support and comments .
——————————————————————————-
On monthly Gann Square, XLM start rising after passing Gann Square Arc resistance.
With refer to first weekly Bullish Gann Square, expect to hit 0.75 Gann price Zone at cross Zone of Rejected Monthly Gann Fan line .
2024 is look like good year for Crypto currencies and XLMUSDT has an opportunity to grow to about 2000 - 2300 % .
Chart updated and route plotted with help of Gann Square and Gann Box.
Good luck and safe trades.

XLM/USDT looks incredibly promising at the moment! 🚀 📈💰 The 4-hour time-frame shows a strong bullish market structure, indicating a potential uptrend in the making. 🐂✨ Moreover, the current price is precisely situated within a demand zone, suggesting a high probability of a 15-30% bullish move in the short term. 📈💥 Let's keep a close eye on this exciting opportunity and see what unfolds! Remember, this is not financial advice. 🧐🔍

XLM New TargetWith a short break here, Stellar will move towards the next target of 0.2477, which will happen shortly after the accumulation phase.

Lower Boundary Of The Trading Range➔ XLM is currently positioned within a trading range, marked by a support level at $0.1015 and a resistance level at $0.1350. At present, the price is following a downward trajectory, aiming to reach the lower boundary of this trading range. This indicates that the focus is on reaching the support level at $0.1015, suggesting a potential bearish trend within this specified price corridor.
This analysis is informational, not financial advice.

XLM.USDTStellar moves very technically and logically in a channel.
I don't think the downward trend line will break.
However, any possibility is possible in the financial markets.

XLM.USDTin a sensitive zone.
Stellar is trying to exit the channel.
If it manage to get out, it will grow well.
If this fails, a fall and correction to $0.11 is inevitable.

XLMwe are in big support area and if we defending this zone we can go higher then expected
targets are
0.135$
0.1461$
0.16$

#XLM #StellarIn the daily and weekly time, it is moving in an upward channel for a short period of time, and the pullback to the 12 cents area and leaving the density and the bottom of the channel can continue its growth up to the neck line and the middle of the channel, and if it stabilizes above the red band in the daily time OK, it can continue its growth up to the weekly supply area

XLM/USDT💰#XLM reached the ceiling of the ascending triangle pattern on Daily time frame,we are waiting for breakout now 👀

TRICKY TREND LINEI believe price will react to this trend line. the trend line is compatible with a major resistance at 40 cents. we will have pullbacks on our way to 40 cents, but i don't know how trading works, so i will just wait for my target and sell. i believe after reaching 40 cents we will have a nice pullback to 25-30 cents and that's when i would be interested in buying back.

possible CUP/Handle formation for Stellar (XLM)Don't want to write down complex things. Make it simple, it's all in the chart.
Just an educational idea about a possible development of a chart pattern, not a financial advice.


XLMUSDT Long Term, anticipating ATH for the year 2024Accumulation phase below the price of 15 cents. Will or may reach $1 and above this coming year 2024 . Good luck!

The xlm currency is very technical and excellentThe xlm currency is very technical and excellent, it has a big surprise in the near future, this currency has reached the bottom of the channel after the correction, and after the formation of the reverse head and shoulder pattern, it is collecting liquidity for a big growth to the top of the channel, hold the xlm currency Do, it's great for the long run

The xlm currency is very technical and excellentThe xlm currency is very technical and excellent, it has a big surprise in the near future, this currency has reached the bottom of the channel after the correction, and after the formation of the reverse head and shoulder pattern, it is collecting liquidity for a big growth to the top of the channel, hold the xlm currency Do, it's great for the long run

⚡️XLMUSDT CMC TRADING ⚡️ RISING WEDGEXLMUSDT has formed a rising wedge pattern, and the recent identification of a bearish breakout along the lower boundary has been observed. Our expectation is for a continuation of the bearish trend, targeting the demand zone situated at the bottom.
