XLM long ideaI think XLM has some good potential for a rise, even though hasn't been in a SL hunt yet and that is the only problem with this idea.
Nonetheless, we are seeing a squeeze in the price(fight) between support and resistance. IF a break to the upward happened, I will enter a long trade according to my idea. SL will be determined upon entry.
XLMUSDT trade ideas

Xlm is rising up hi my friends today i have this analyses for you
formation of candles are good in 4h time frame
if it can make a closer above green trend line and ema200
i think it can rise to 0.618 lev of fibonacci (0.222 $)

$XLM - LONG on #stellarlumens if 0.24 resistance is brokenI'm placing a LONG on XLM if I see a 1D close above the daily resistance
the price has succesfully retested the 4h support level and is now heading for the next resistance: if it is broken we can look for the following one to be tested
entry around 0.25
TP 0.29
SL 0.23
(prices are estimates)

XLMUSDT back to 0.196?When the market creates a daily structure candle we can expect the market to test this candle (blue bloxed). We do need to wait untill all the checkboxes are checked and the circumchances are in our favor. So let's wait for that before we take this trade back to the 0.196 region

Long on XLM$XLM broke through the descending trendline and the resistance level. Bullish movement to resistance level at 0.2228$

💡Don't miss the great buy opportunity in XLMUSD @StellarOrgTrading suggestion:
". There is a possibility of temporary retracement to the suggested support line (0.1995).
. if so, traders can set orders based on Price Action and expect to reach short-term targets."
Technical analysis:
. XLMUSD is in a range bound, and the beginning of an uptrend is expected.
. The price is below the 21-Day WEMA, which acts as a dynamic resistance.
. The RSI is at 58.
Take Profits:
TP1= @ 0.2062
TP2= @ 0.2122
TP3= @ 0.2187
TP4= @ 0.2265
TP5= @ 0.2342
SL= Break below S2
❤️ If you find this helpful and want more FREE forecasts in TradingView
. . . . . Please show your support back,
. . . . . . . . Hit the 👍 LIKE button,
. . . . . . . . . . Drop some feedback below in the comment!
❤️ Your support is very much 🙏 appreciated!❤️
💎 Want us to help you become a better Forex / Crypto trader?
Now, It's your turn!
Be sure to leave a comment; let us know how you see this opportunity and forecast.
Trade well, ❤️
ForecastCity English Support Team ❤️

💡Don't miss the great buy opportunity in XLMUSD @StellarOrgTrading suggestion:
". There is a possibility of temporary retracement to the suggested support line (0.1995).
. if so, traders can set orders based on Price Action and expect to reach short-term targets."
Technical analysis:
. XLMUSD is in a range bound, and the beginning of an uptrend is expected.
. The price is below the 21-Day WEMA, which acts as a dynamic resistance.
. The RSI is at 58.
Take Profits:
TP1= @ 0.2062
TP2= @ 0.2122
TP3= @ 0.2187
TP4= @ 0.2265
TP5= @ 0.2342
SL= Break below S2
❤️ If you find this helpful and want more FREE forecasts in TradingView
. . . . . Please show your support back,
. . . . . . . . Hit the 👍 LIKE button,
. . . . . . . . . . Drop some feedback below in the comment!
❤️ Your support is very much 🙏 appreciated! ❤️
💎 Want us to help you become a better Forex / Crypto trader ?
Now, It's your turn !
Be sure to leave a comment; let us know how you see this opportunity and forecast.
Trade well, ❤️
ForecastCity English Support Team ❤️

Stellar XLM Price Targets and Stop LossXLM/USDT
Entry Range: $0.19 - 0.21
Price Target 1: $0.23
Price Target 2: $0.26
Price Target 3: $0.30
Stop Loss: $0.17

XLMUSDT - SETUPXLMUSDT
Price is moving in a good momentum after printing a breakout and then retested it. Now we are expecting a surge up to the next resistance level and will complete the harmonic pattern formation.

Is Stellar growing?XLM is ready to jump upwards after a retreat.
If the number of followers reaches 100 this week, I will put pure analysis every day.
Follow fractal_analysis98

XLM take profit TP1: 2.15$ TP2: 3.61$XLM take profit
Stellar is involved in a lot of CBDC development along with BITT. They launched smart contracts and developers are consistently hosting developer tournaments/competitions with the active and growing community of Stellar. LFG.
TP1: 2.15$ TP2: 3.61$


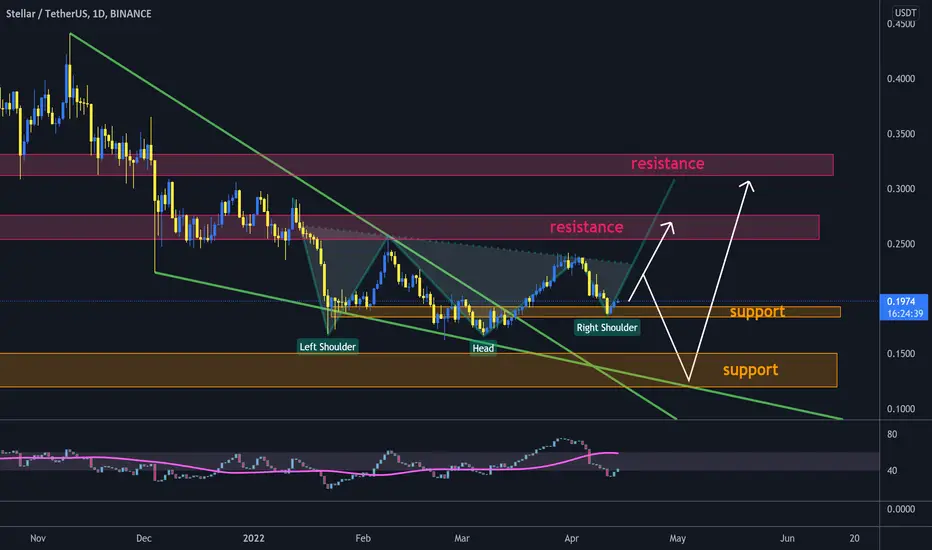
XLM broke out falling wedge and can shape inverse H&S#XLM/USDT
$XLM broke out from falling wedge, and hold the support zone.
🐮 holding the support can increase price to $0.23 that is around neck line of inverted head and shoulders pattern.
break out from neck line will increase price to resistance zone around $0.27 and $0.32.
🐻 rejection from neck line will drop price to break down current support and reach support zone between $0.15 and $0.12, that will be a pullback to broken falling wedge.
This week's closing price for XLM Coin will sort out the market Stellar coin appears to be in minor recovery phase for the short-time period, on the flip side it's still bearish in weekly chart.
The XLM coin price is presented below the essential moving averages (such as 20,50,100 and 200 EMAs) on the daily price graph.
The daily RSI is showing a bullish trend with a half-line (50 points) as an indicator. However, the RSI did not move into the overbought zone before recovery, which means that XLM has a bullish potential.
The ADX indicator continues to move down and forms a low-high pattern in the context of the daily price graph.
For a strong bullish run, the bulls need to push the Stellar coin above the $0.24 resistance level as soon as possible. On the other hand, if they fail to manage the act, the wide range consolidation phase may continue for a long time.
Support level- $0.1850 and $0.160
Resistance level- $0.240 and $0300

XLMUSDT Analysis (LOCAL VISION)Hello friends.
Please support my work by clicking the LIKE button👍(If you liked). Also i will appreciate for ur activity. Thank you!
Everything on the chart.
I am waiting for an upward movement from the current price or through one more decline until ~0.16-0.15$ (It all depends on BTC)
Entry: market and lower
Target: 0.22 - 0.24 - 0.26
Stop: (depending of ur risk). ALWAYS follow ur RM .
after first target reached move ur stop to breakeven
risk is justified
Good luck everyone!
Follow me on TRADINGView, if you don't want to miss my next analysis or signals.
It's not financial advice.
Dont Forget, always make your own research before to trade my ideas!
Open to any questions and suggestions.

Market structur#XLM slightly gave a close below candle on the trendline and due to #BTC dumped hard, price broke below it. If daily candle closed below it then you can expect continuation in dump $0.17 and below. Support is around $0.169 - $0.175.

Open Short Position on XLMUSDT!After Nice weekend, XLM passed 0.20200$ price Line on daily chart, Then opened Short Position! and Due to can select the Low SL, So we can get reach to higher Risk/Reward than 1:2!


XLM end of falling wedge?XLM is about to break out of the falling wedge we have been in for months. 0.19$ - 0.20$ is an important support we are now approaching. Possible long trade

XLM ; Into Falling Wedge Pattern ReversalXLM has been trading a falling wedge pattern since may 2021.for now xlm after that price had touch upper trend line and price rejected , i expected it will probably further bearish to 0.18 ~ 0.17 zone again just like a last month and after that the XLM will prepare to break out Falling wedge bearish pattern and it is ready to flying to reach to 0.4 or even higher that as you see on the chart.

Open Short Position on XLMUSDT!I got many profit from XLMUSDT, so After I reached to my Target in last position and checked the movement of BTC, I decided to open another short Position on XLM, Tomorrow is Saturday and They said the Volume will be decrease and Traders most go for holidays! lol
They earn money during in week, to spend it on Weekend! Is it Right?

Open Short Position on XLMUSDT!Its Downtrend on weekly and daily, and in 4H Time frame, You can see the break down!

Without indicators!Hi, I am Beginner and learning how to trade! If you like, follow me to teach me!
I am using supports and residences lines of Monthly, weekly and daily!
Yours
Abi
