XLMUSDTWaiting for a pullback to enter long position. Target flag pattern may break upwards so looking forward to hold my position for weeks.
XLMUSDT trade ideas

XLMUSDT Dear friends, I post this forecast first of all as a note. Yes, right now I am in a trade and expect a shot up to the indicated targets. Of course, in long-term trading, I expect $4 potential. But first we need to break through the resistance levels. We look at what the Gartley butterfly has prepared for us. Good luck to everyone in the auction. Selling from TP1

XLM is gonna reach 0.34$ one way or another!🌳XLM is in a Rounded Bottom. this Means The Price can Increase as much as the Length Between the Top & Bottom Of this Pattern, after a Break out Happens. The Price Can Start to Increase From Here OR It can Do a Little More Correction and Create a Cup and Handle Pattern and after That The Price Would Increase! In Both Cases we Should Expect a Bullish Movement up to 0.34$
_ _ _ _ _ _ _ _ _ _ _ _ _ _ _ _ _ _ _ _ _ _ _ _ _ _ _ _ _ _ _ _ _
Thank you for seeing idea .
Have a nice day and Good luck

Stellar longStellar broke trough off the upper boundary of descending channel. Bullish movement to resistance level at 0.32 is expected to happen.

XLM/USDT Stellar technical analysis !!! Current technical analysis on XLM/USDT better known as Stellar, it has broken out of a clean triangle around 5 days ago and is on the rise! With the current situation it will test market at its current resistance and choose whether to test positive and go with my scenario of that outcome or go negative and express my other scenario which also has an amazing optimal buy zone at the bottom of the channel, but in my opinion i think it will test positive due to the current market situation and BTC being on the rise.
Red line = (0.2) current strong support
Yellow line = (0.24) current test market zone and strong resistance meaning if it tests negative it will pummel down to (1.8) which is a good optimal buy zone, however with the positive test market scenario it will go up to around the (0.3-0.31) range and if it breaks it will go up to 0.35 however be careful at that price since that is a very strong previous resistance and it may give a negative response to the test market!!!
Orange line = Future extremely strong resistance and one of the optimal selling points
Green line = Future strong resistance if breaks orange line and you are still holding would sell of there to secure a beautiful profit however if BTC starts to rise and go bullish again it may break it and reach top of the channel it should be your call whether you would hold past the point or sell (personally i would cash out to minimize risk
If you have any questions or anything else to add to my analysis such as some criticism that would be greatly appreciated just drop a comment and i will answer every single one asap, and let me know what other crypto, or stock graphs you would like me to analyse anything but commodities since its a pain in the ass. :D
BINANCE:XLMUSDT


Stellar XLM Price Targets and Stop LossXLM/USDT
Entry Range: $0.21 - 0.24
Price Target 1: $0.29
Price Target 2: $0.34
Price Target 3: $0.41
Stop Loss: $0.17

XLM (Stellar Lumens) Coin Analysis 28/03/2022Fundamental Analysis:
Stellar is an open network that allows money to be moved and stored. When it was released in July 2014, one of its goals was boosting financial inclusion by reaching the world’s unbanked — but soon afterwards, its priorities shifted to helping financial firms connect with one another through blockchain technology.
The network’s native token, lumens, serves as a bridge that makes it less expensive to trade assets across borders. All of this aims to challenge existing payment providers, who often charge high fees for a similar service.
If all of this sounds familiar, it is worth noting that Stellar was originally based on the Ripple Labs protocol. The blockchain was created as a result of hard fork, and the code was subsequently rewritten.
Fees are a sticking point for many. However, high costs when making cross-border payments aren’t just exclusive to fiat-based payments solutions such as PayPal — transaction fees have also been known to go through the roof on the Bitcoin and Ethereum blockchains because of congestion.
Stellar is unique because every transaction costs just 0.00001 XLM. Given how one unit of this cryptocurrency only costs Les than a cent at the time of writing, this helps ensure that users keep more of their money.
Few blockchain projects have managed to secure partnerships with big-brand technology companies and fintech firms. A few years ago, Stellar and IBM teamed up to launch World Wire, a project that allowed large financial institutions to submit transactions to the Stellar network and transact using bridge assets such as stable coins.
Although other blockchains have community funds, meaning that grants can be given to projects that help further the ecosystem, Stellar allows its users to vote on which ventures should be given this support.
This network is secured using the Stellar Consensus Protocol, which is described as having four main properties: “Decentralized control, low latency, flexible trust, and asymptotic security.”
Through SCP, anyone is able to join the process of achieving consensus, and no single entity can end up with the majority of decision-making power. Transactions are also confirmed cheaply and within a few seconds — and safeguards are in place if bad actors attempt to join the network.
Jed McCaleb founded Stellar with the lawyer Joyce Kim after leaving Ripple in 2013 over disagreements about the company’s future direction.
In explaining the rationale behind Stellar in September 2020, McCaleb Announced “The whole original design of Stellar is that you can have fiat currencies and other kinds of forms of value run in parallel with each other and with crypto assets. This is super important to drive this stuff mainstream.”
McCaleb’s goal is to ensure that Stellar can give people a way of moving their fiat into crypto — and eliminate the friction that people normally experience when they are sending money around the world.
He currently serves as the CTO of Stellar, as well as the co-founder of the Stellar Development Foundation. This not-for-profit organization aims to “unlock the world’s economic potential by making money more fluid, markets more open, and people more empowered.”
A total of 100 billion XLM were issued when the Stellar network launched in 2015 — but things have changed since the release date. At present, the total supply stands at 50 billion XLM, and the circulating supply is currently 24.69 billion.
In 2019, the Stellar Development Foundation announced that it was burning over half of the cryptocurrency’s supply. This means that it now controls approximately 30 billion XLM. While some of this capital is earmarked for marketing and helping the organization develop, about one third is reserved for making investments in other blockchain ventures.
Explaining why it took this drastic move — and promising not to burn any more XLM in the future — the foundation explained: “SDF can be leaner and do the work it was created to do using fewer lumens… Those 55.5 billion lumens weren’t going to increase the adoption of Stellar.”
The current CoinMarketCap ranking is #31, with a live market cap of $5,747,715,926 USD. It has a circulating supply of 24,687,940,800 XLM coins and a max. supply of 50,001,806,812 XLM coins.
Technical Analysis:
The Asset is currently at the 78.6% Fibonacci Retracement Zone which is Hypothetically the Golden zone for the Illiquid Assets. it is a very Powerful Accumulation zone and we can observe the smart money inflow, eventually Big Impulsive wave thus start of the new cycle.
There exist the Regular Bullish Divergence of Price Value from MACD, which is the very Significant sign of Bearish Trend Reversal eventually Start of the new Bullish Trends.
As the price value Start its Bullish trend From these kind of Discounted Zones such as Fib 78.6% or lower, we can Rationally expect the ATH to be easily Achievable and ultimately developing the new cycle thus new ATH.
There are Total of 3 Targets defined by the Average Confluences of the Fibonacci Expansion and Fibonacci Trend Base Extension. these confluences Points can even be counted as the Major Pivot Points.
The 3 TP gets its confirmation as the Bullish trend Triggers the 2 TP followed by some Price correction and Reaccumulation. on its Up Formation rally.

XLM (Stellar) Coin Analysis 19/03/2021we have analyzed it earlier and capitalize on this coin twice earlier:
4H Time Frame:
Day Time Frame:
Fundamentals:
Stellar is an open network that allows money to be moved and stored. When it was released in July 2014, one of its goals was boosting financial inclusion by reaching the world’s unbanked — but soon afterwards, its priorities shifted to helping financial firms connect with one another through blockchain technology.
The network’s native token, lumens, serves as a bridge that makes it less expensive to trade assets across borders. All of this aims to challenge existing payment providers, who often charge high fees for a similar service.
If all of this sounds familiar, it is worth noting that Stellar was originally based on the Ripple Labs protocol. The blockchain was created as a result of hard fork, and the code was subsequently rewritten.
Fees are a sticking point for many. However, high costs when making cross-border payments aren’t just exclusive to fiat-based payments solutions such as PayPal — transaction fees have also been known to go through the roof on the Bitcoin and Ethereum blockchains because of congestion.
Stellar is unique because every transaction costs just 0.00001 XLM. Given how one unit of this cryptocurrency only costs a few cents at the time of writing, this helps ensure that users keep more of their money.
Few blockchain projects have managed to secure partnerships with big-brand technology companies and fintech firms. A few years ago, Stellar and IBM teamed up to launch World Wire, a project that allowed large financial institutions to submit transactions to the Stellar network and transact using bridge assets such as stablecoins.
Although other blockchains have community funds, meaning that grants can be given to projects that help further the ecosystem, Stellar allows its users to vote on which ventures should be given this support.
Jed McCaleb founded Stellar with the lawyer Joyce Kim after leaving Ripple in 2013 over disagreements about the company’s future direction.
In explaining the rationale behind Stellar in September 2020, McCaleb told CoinMarketCap: “The whole original design of Stellar is that you can have fiat currencies and other kinds of forms of value run in parallel with each other and with crypto assets. This is super important to drive this stuff mainstream.”
McCaleb’s goal is to ensure that Stellar can give people a way of moving their fiat into crypto — and eliminate the friction that people normally experience when they are sending money around the world.
He currently serves as the CTO of Stellar, as well as the co-founder of the Stellar Development Foundation. This not-for-profit organization aims to “unlock the world’s economic potential by making money more fluid, markets more open, and people more empowered.”
Current Fundamental:
The live Stellar price today is $0.402482 USD with a 24-hour trading volume of $832,342,993 USD. Stellar is up 2.85% in the last 24 hours. The current CoinMarketCap ranking is #13, with a live market cap of $9,109,323,999 USD. It has a circulating supply of 22,632,881,017 XLM coins and a max. supply of 50,001,806,812 XLM coins.
The top exchanges for trading in Stellar are currently Binance, Huobi Global, OKEx, BitZ, and Upbit. You can find others listed on our crypto exchanges page.
Technical Analysis:
the coin is currently in a retracement from the Past Impulsive wave and is now on the Reaccumulation Phase for another Impulsive wave and Rally.
As you can see there is Hidden Bullish Divergence of Price and MACD, which is the sign of Bullish trend continuation.
we have specified 3 New Targets with Fibonacci Projection of the previews Impulsive Cycle, where as the 3 TP gets its conformation as the price Triggers the 2TP followed by the price Correction and some distributions.

XLM (STELLAR) Started Shooting 28/01/2021Hi
as we had specified in the chart
very intuitive
please comment your opinions

XLM LONGSTELLAR on the 1D timeframe looks very promising here after falling wedge breakout.
With support at $0.18, we should make some nice returns with coming uptrend.


XLM analysisThe term Stellar cryptocurrency refers to a digital or virtual currency developed by Stellar Development Foundation. The organization's currency, which is called the lumen, is traded under the symbol XLM on various cryptocurrency exchanges.

XLM Long at daily timeframe the candle already break the trendline with good bullish engulfing so it will expect that the price will going up to rich to another level

XLM breaks bearish channel - Bullish price actionXLM has broken upward from its bearish channel. EMA9 is converging on EMA50; crossover would be nice confirmation, but it's probably worth a long position at this stage already. Set tight stop loss because you never know what Putin will do next to spoil the party.

Stellar longStellar broke trough the descending trendline. Asset broke trough the resistance area. Bullish movement to resistance level at 0.222 is possible.

xlm looking good xlm is looking great to accumulate down here,
could potentially be close to breaking the down trend

XLMUSDT LONG TERM BUYAs you can see, price is consolidating in the support zone, so I'm waiting for a long term bullish move from the zone. It's a long term signal, you can buy and hold this crypto from now to the new ATH in the future. Stay safe!

XLMUSDT - Long by Supertrend 3/16/20224h timeframe: Supertrend indicator > Long.
- 1h timeframe: Wait a correction (Short) and breakout short for long to open a Buy follow 4h timeframe.
... Short correction (Supertrend 1h)
...Short correction be broken:

XLM USDT LTF/MTFXLM seems to be forming a rising wedge. Indicators are pointing towards a bearish divergence. We can expect a touch to an EMA and proceed to short it. BINANCE:XLMUSDT

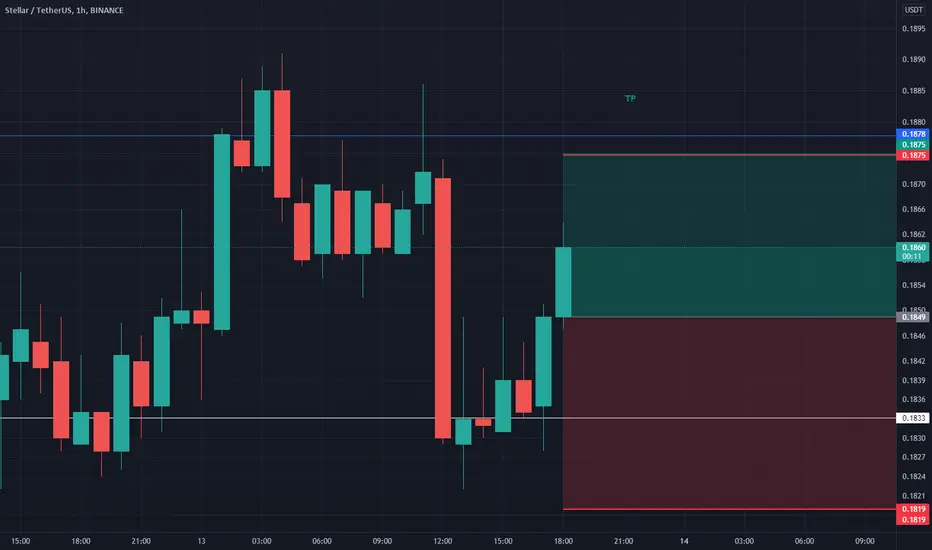
XLMUSDT (Long)XLMUSDT is bouncing is range of support and resistance from 4 hourly resistance level
Long
Entry at 0.1850
Take Profit at 0.1875
Stop loss at 0.1819
Risk/reward ratio of 1:0.87

XLM BUY SETUPXLM Breakout descending triangle and valid retest after breakout
Expecting upward movement 🚀
Growth buy volume , MACD Daily bullish crossover
Stoploss : $0.17
