XLMUSDTThe price is in a large range and fluctuates in it, if the ceiling breaks, it can reach the price of $ 1.1 and finally $ 3.2.
This is if bitcoin is to grow well, otherwise this analysis will be flawed
XLMUSDT trade ideas

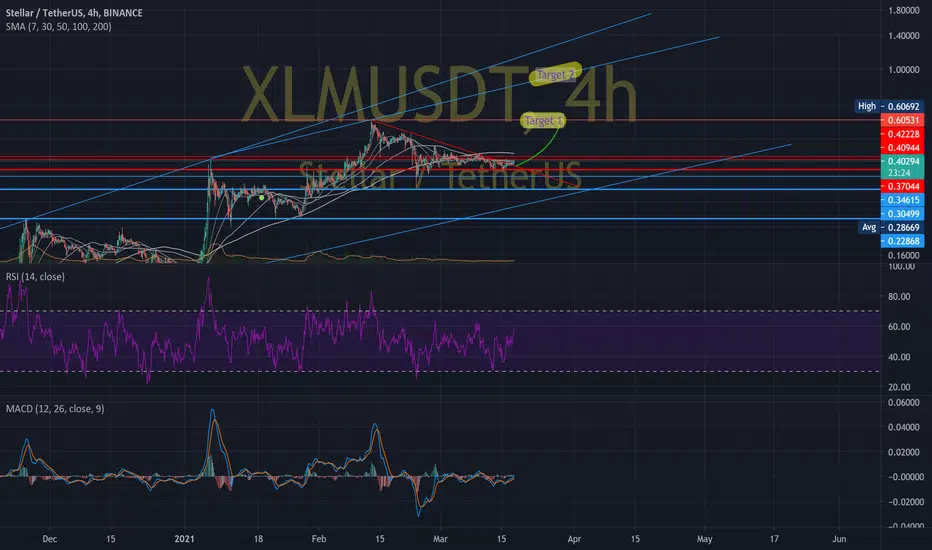
STELLAR IS TRADING IN RANGE RIGHT NOWHello my friends, today I want to talk with you about XLM.
Price is growing to upside of this range.
I'm waiting that Stellar can reach it soon and break.
If this will happen, we will have good signal to open new long position.
As a target we will have next two good levels (0.3650 and 0.4300).
This is article not financial advice, always do your own research.
If you have any questions, you can write it in comments below and I will answer them.
And please dont forget to support this idea with your like and comment, thank you.

XLM - Let's visit $0.25 - $0.24 againHi,
This is iJusctCoint, the one lucky trader who puts his money where his mouth is!
Crypto bounced from lower levels to test the resistance again. We have upward pressure on the 12H and 1D timeframes which is quite healthy.
I expect the price to comeback once again to the lower boundary to test the support.
I plan to capitalize on that potential move down my taking a short position.
Publication marked as NEUTURAL since we don't know our trend just yet.
We may establish a downtrend with a lower low and a lower high or may finally reverse.
I'll trade SHORT and reverse to LONG if support holds.
//
Chart Code:
Red Dashed Lines - Downwards reversal Momentum
Green Dashed Lines - Upwards Reversal Momentum
Green Rectangle - Buying Area
Red Rectangle - Selling Area
Yellow Dotted Lines - Estimate Timerange where price target might get hit
//

XLM try to break out long term resistance#XLM/USDT
$XLM is trading exactly below weekly and daily descending resistance lines.
if price break out from this descending resistance, it will increase to resistance zone between $0.36 and $0.39.
but if price reject from current descending lines, it will drop to support zone around $0.2 and then maybe try to break out from resistance.

XLM has bounced from the support of triangleHi friends, hope you are well, and welcome to the new update on Stellar ( XLM )
Weekly support and SMA:
On a weekly time frame, XLM is still moving below the support of a rising wedge which has turned into a resistance. But we have a nice support of 100 SMA and price support of $0.255.
Triangle:
On a daily time frame, Stellar is nicely bounded by the support of a descending triangle. Now if the priceline breaks out the resistance, then XLM can re-enter the big wedge on the weekly time frame.
Note: Above idea is for educational purpose only. It is advised to diversify and strictly follow the stop loss, and don't get stuck with trade

XLMUSDTEntries:- 0.25 to 0.26
Xlm can be a good entry I'm pretty much positive on buying before breakout need some confirmation from btc. Another reason for taking risk in choppy market is that xlm is holding aqua airdrop on 15th January which is why I consider it to perform just like OMG during its Airdrop. Another thing to consider is that you must exit quickly after the airdrop snapshot as we can see what happened to xrp and omg after airdrop snapshot ended. Thank you.
I'm new if you like my work please support me with a cup of coffee would help to DCA some of my previous holdings:- TRC20 usdt
TNZYq3agpLhZxgZwho1BGeqkpQ2gBAiyWR

Xlmusdt to kooMon 1.3 3737 dhdhd dhdhd you have a great my friend I have to go to hell with my friend I hope it mean when you dream about

XLMXLM bounded by dynamic support and medium-term dynamic resistance, static resistance in area 043 in evidence, the small yellow triangle could accelerate the resumption of a new trend


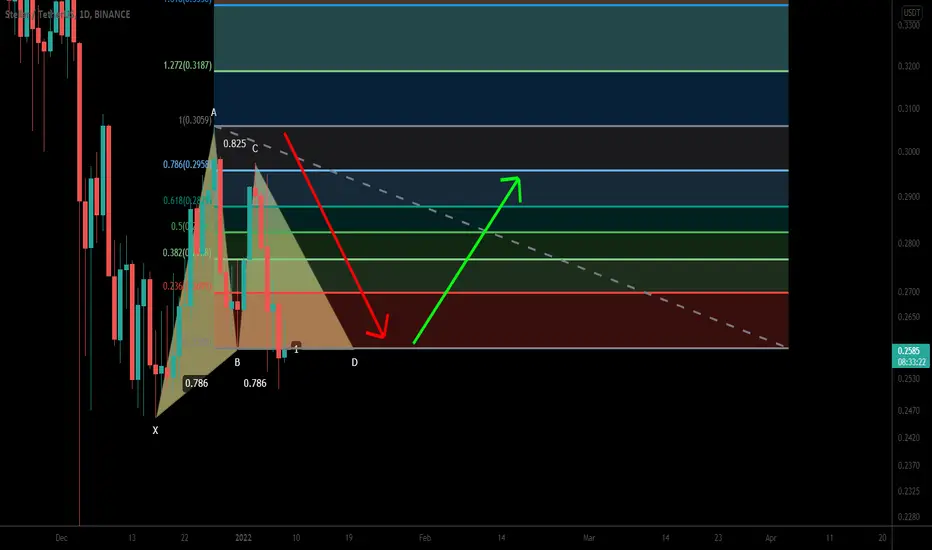
Stellar (XLM) formed bullish Gartley for upto 20% moveHey friends, hope you are well, and welcome to the new trade setup of Stellar ( XLM )
Previously I shared a harmonic trade of XLM which is still in play:
Now on a daily time frame, XLM has formed a bullish Gartley.

XLM's Break out will Determine The Trend Soon.Hello every one
STELLAR / TETHERUS
XLM is In a Symmetrical Triangle. The Pattern Has not Been Broken By The Price Yet. Depending on The Incoming Break out, We can Expect The Price to move Upward or Downward as Much as The Measured Price Movement (AB=CD) The Incoming Break out will Determine The Trend For XLM. The Support & Resistance are Shown in The Picture.
💎Traders, if you liked this idea or have your opinion on it, write in the comments, We will be glad.
Things can change...
The markets are always changing and even with all these signals, the market changes tend to be strong and fast!!
Thank you for seeing idea .
Have a nice day and Good luck

XLM Stellar Lumens Expected Move - XLMBTC XLMUSD XLMUSDTXLM Stellar Lumens Expected Move - XLMBTC XLMUSD XLMUSDT

STELLAR - Bearish Pennant Shorts!Our last analysis was a higher timeframe analysis of Stellar and we found that we were in an ABC correction with 2 possible areas of interest, with one being unlikely. See below:
Currently we appear to be in a bearish pennant for one last move down.
Trade Idea:
- Watch for strong bearish candles on lower timeframe or a correction
- Enter on break of correction with stops above the pennant
- Target the 0.20 where we will be looking for a reversal
Goodluck!

XLMUSDT 1HrXLM seems to have completed an impulse wave A or 1 here. The larger direction looking upwards. A 'C' or wave '3' likely in progress.
