XLMUSDT Elliott Waves AnalysisHello friends.
Please support my work by clicking the LIKE button👍(If you liked). Also i will appreciate for ur activity. Thank you!
Everything on the chart.
growth from current price or through one more decline in zone 0.07 - 0.065$
I dont wanna miss trend that's why im already in pos and will buy more if we get one more decline.
Entry: market and lower (0.085 - 0.065)
Targets: 0.1 - 0.12 - 0.135 - 0.15
after first target reached move ur stop to breakeven
Stop: (depending of ur risk). ALWAYS follow ur RM .
risk is justified
Good luck everyone!
Follow me on TRADINGView, if you don't want to miss my next analysis or signals.
It's not financial advice.
Dont Forget, always make your own research before to trade my ideas!
Open to any questions and suggestions.
XLMUST trade ideas

xlmusdtxlmusdt looks like in accumulation phase .we may be in manipulation phase after that we might see an expansion phase .
NFA DYOR

XLMUSDT | APPROACHING TO SUPPORTSTELLAR has been trading in a bearish trend .
The price has been making lower lows and lower highs.
Now after breaking some major support, price has approached to strong horizontal support zone .
The bulls can take control from here.
Manage your levels accordingly.

Stellar - XLMUSDT .. Buy The Dip Buy stellar on spot , add stellar if it dips ,add stellar when it rallies , hold stellar until 2026 ..


XLMUSDSTFormed Text Book Falling wedge in # Day timeframe
Rsi printed Bulish Divergence Too
expecting Massive bulish move Soon
Waiting For breakout

#Stellar Lumens Floats from $0.082, XLM under PressurePast Performance of Stellar Lumens
Stellar Lumens prices are steady at spot rates, moving tight inside a broader bear flag and technically bearish from a top-down preview. Even though there are flashes of strength, bulls must push above immediate resistance levels at $0.092 and later at $0.10 if XLM is to recover.
#Stellar Lumens Technical Analysis
XLM prices are inside a bear flag and bearish, trending in line with losses of early November 2022. Although the broader crypto market appears to be bouncing higher, XLM has support at around $0.082. While there are higher highs relative to the lower BB, prices are within a bear formation. Aggressive bears can unload on every attempt below $0.92 or November 9 high. However, any surge above this line will constitute a bull breakout formation, an opportunity for XLM buyers to load the dips, aiming for $0.10 or November 10 highs. Conversely, sharp losses below the immediate support may force XLM lower to $0.065 or Q3 2020 lows.
What to Expect from #XLM?
XLM is under significant pressure at spot rates, down over 90 percent from 2021 peaks. Accordingly, buyers must strive to push prices above the immediate liquidation levels and reverse November 9 losses for bulls to stand any chance of catalyzing demand.
Resistance level to watch out for: $0.092
Support level to watch out for: $0.082
Disclaimer: Opinions expressed are not investment advice. Do your research.

XLMUSDT Elliott Waves (Local Setup)Hello friends.
Please support my work by clicking the LIKE button👍(If you liked). Also i will appreciate for ur activity. Thank you!
Everything on the chart.
Entry: market and lower
Target: 0.095 - 0.102 - 0.105
after first target reached move ur stop in breakeven
Stop: ~0.083 (depending of ur risk). ALWAYS follow ur RM .
Risk/Reward: 1 to 4.5
risk is justified
Good luck everyone!
Follow me on TRADINGView, if you don't want to miss my next analysis or signals.
It's not financial advice.
Dont Forget, always make your own research before to trade my ideas!
Open to any questions and suggestions.

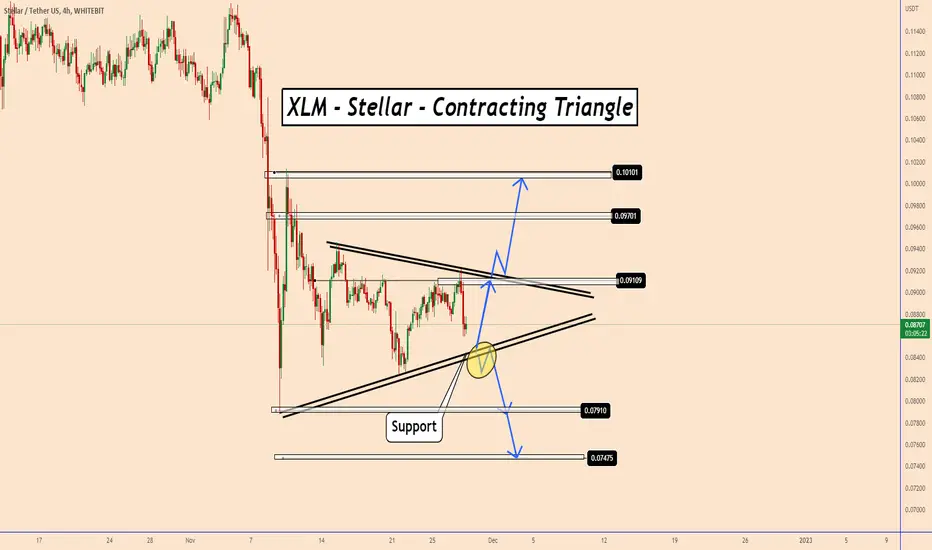
XLM | Stellar | Contracting TriangleXLM | Stellar | Contracting Triangle
Price is creating a contracting triangle and it has to decide where to move
next.
Actually it is testing the lower zone of the pattern and it can rise again
from that point.
If the price will manage to break down the triangle pattern it should move
down further
Targets on the chart!
Thank you and Good Luck!
Stellar reacted well to its monthly support level!Stellar reacted well to its monthly support level over the past week. After the price of this currency hit the support level of the previous floor due to the formation of positive divergence in the daily time, the price of this currency increased in the 1-hour time. The trend is bullish on the 1-hour time frame but not yet on the 4-hour time frame, and we can see the range area on the chart. Several resistance support ranges are considered on the chart.
The closest resistance that the current price is below this level is in the range of $0.090, which, if this level is broken with buying pressure, the next targets for buyers are in the range of $0.097 to $0.100. In general, due to the price of this currency in the above time frames, it has been placed on important support levels, and the possibility of its trend being ranged for several weeks is high. Price growth can be accompanied by a negative reaction after reaching the resistance of the $0.10 range, and further support levels can be tested.

XLMUSDT PROFIT POTENTIAL 487%Formed Falling Wedge in WEEKLY tf
incaase of breakout expecting minimum 4 to 5x
note always wait for confirmed breakout

XLMUSDT Support And Resistance Ranges UpdateThe resistance range specified by the price was touched.

XLMUSDT Support And Resistance RangesPrice support and resistance ranges are specified for the symbol ( XLMUSDT ) .

XLMusdtThis personal analyse
you research and buy
GL
EntryPoint:
0.0888
0.0799
0.0687
Supports:
0.0568
0.0446
0.0393
0.0327
Resistances:
0.0986
0.1124
Targets:
0.1260
0.1682
0.2681
MidTime:
0.3738
0.5705
Hodl:
0.9771
1.2940
1.9368
GL

XLM - Wait For The Bulls!Hello TradingView Family / Fellow Traders. This is Richard, as known as theSignalyst.
XLM last week broke below the gray support and now approaching the green weekly demand zone.
For the bulls to take over from a short-term perspective, we need a daily closing back above the gray zone.
And then for the bulls to remain in control long-term, we need a daily break above the upper blue zone.
Meanwhile , until the bulls take over, XLM would be bearish and as we dive inside the weekly demand zone in green we will be looking for new buy setups to form.
Always follow your trading plan regarding entry, risk management, and trade management.
Good luck!
All Strategies Are Good; If Managed Properly!
~Rich


XLMUSDT New ATH Target after the correction endsUptrend seems nice and clean.. still heading up if no bearish penetration on the way to discourage the accumulation phase and make it a bit late, but overall after the correction, an accumulation phase starts and the rise is likely to happen and new ATH will be awaiting.
Trade infos>>>>
Trade Type: Swing
Average Time: 2 Months
Buying area: 0.45 - 0.4 ( buying once at 0.45 and another one at 0.4 is preferable ) Wait for it to reach the area then you can buy.
Wallet entry %: 10%.
TP: 0.84 ( might change when idea updated ).
Expected Profit % : 95% expected .... 60% at least.
......
Notices:
1- We might change The TP to be suitable if the TP target was too high.
2- Sticking to the rules of the trade is essential for maximizing profits and avoiding losses or any other turbulences on the way.
3- If you enter the trade it's best to follow the trade for any further updates.

XLM USDT 105 1024XLM USDT 105 1024
- 105 bar cycle
- 1024 % grow (fractal == 1 gb = 1024 mb = 1024 * 1024 kb = 1024 * 1024 * 1024 b )
- 20 March 2023
- 505
- 555

XLMUSDT Analysis (Local Setup)Hello friends.
Please support my work by clicking the LIKE button👍(If you liked). Also i will appreciate for ur activity. Thank you!
Everything on the chart.
Entry: market and lower
Target: 0.13 - 0.15 and maybe 0.17
after first target reached move ur stop to breakeven
Stop: ~0.099 (depending of ur risk). ALWAYS follow ur RM .
Risk/Reward: 1 to 5
risk is justified
Good luck everyone!
Follow me on TRADINGView, if you don't want to miss my next analysis or signals.
It's not financial advice.
Dont Forget, always make your own research before to trade my ideas!
Open to any questions and suggestions.

Is XLM in the sights for new bullish rally?It's funny. XLM, an old-school cryptocurrency, is undecided about where to move forward, or so its market would have us believe.
Currently, in XLMUSDT, on the 4H chart, a descending triangle is present, which, figures its break to the upside, but for the 3rd time. This is because the previous 2 attempts never made the ideal confirmation (on the second attempt it did but fell below, so I consider the 3rd as true) and therefore ended up creating a false break.
Now that if this 3rd breakout is witnessed with a real materialized Throwback, I can see light at the end of the tunnel for this cryptoactive.
This light is accompanied by a rectangle (range symbol) on the 4H chart, which shows the consolidation of the price after the true breakout. In turn, we must accompany this with another remarkable figure:
An ascending channel in graph 1H, which coincides with the end of a descending channel, both within the aforementioned range. And this shows upside potential knowing that said bullish channel continues to wake up until the breakout of the rectangle.
And, to complete these indicators, we must mention the 200 EMA in the 4H chart that has been mercilessly breached. Giving another perspective to this asset that may indicate, in a predictable way, a change to a real uptrend. This EMA can be confirmed to give rise to the forecast.
Also, the 200 EMA of 1D is also taken into account, which can be fundamental for the growth of XLM after 0.13$
Now, in the following image I place the possible points of Target for profit collection. Of course, depending on the objectives of each one, they will decide whether to fulfill them or go for other objectives.
Sorry for the pictures, I don't have a pro account yet. I hope at some point to have it so that my ideas are more illustrative.
It is a pleasure to bring you this new idea, and I thank you for the support I have received. I love trading and I wish that my ideas can greatly serve you all.
Salaje writes to you, until next time!

XLMUSDT BULLISH REVERSAL !Hello Traders and everyone, I AM HADI KARAALI, KNOWN AS SNIPERS_FX
If you like the idea, do not forget to support with a like and follow.
XLMUSDT, as we can see from daily time frame price is clearly overall bearish
However, price is now around a massive support zone and round number 1
As we were bearish from a long term, however we are now stuck inside this range
For the bulls to kick in again we need a break above the upper bound of the range
until that price can still dive more before a full reversal
If we had a break below the range then a movement lower would be expected
and as usual follow your trading plan and manage your risk.
Be patient and good luck!

XLM | Falling Wedge Formation..!!
#XLM (update)
Falling Wedge formation in Weekly timeframe..
Seems like Bottomed out & Ready for a Bullish Rally.
In Case of Wedge Upside Breakout, Expecting +200% in the Midterm
Please like the idea for Support & Subscribe for More ideas like this and share your ideas and charts in Comments Section..!!
Thanks for Your Love & Support..!!

XLM Short here is XLM analysis where you can get an idea 🚀
XRP shows Double Top lets hit the target 💥
Stoploss is Must
