XLM/USDTI think it has completed wave 4. I am buying with this setup. 1% risk for this setup. Don't forget about capital management.
XLMUST trade ideas

XLMUSDT pair TAExpecting XLM to tap down with gray on the MTF Wave indicator prior to an attempt to retest flag's upper resistance trendline. check out how an ideal Stochastic Wave reversal looks like on the conceptual MTF on the side for reference..

Its a Good Buy Opportunity By The High R/R📈 Finally Seems XLM Bottomed And Wave E From Main Corrective ABCDE Formation Is Completed At The Local Low Of a Bull Flag, Expect a Breakout From a Flag Soon Toward a 0.568$, 0.726$ And 0.84$

xlmIn the high time frame, it has made a move
If it wants to reverse 50% of the move, it can reach the yellow lines, but on the other hand, there is another channel midline
But in the short term, we have a conflict between the green and red boxes, and a break from either side activates the next areas
It is safer to buy in the blue points

Bullish trend: XLMUSDTThe United Nations has officially recognized Ripple and Stellar as vital components of the global financial infrastructure. The Decaf payment platform is fostering financial inclusion in Latin America and Africa. SWIFT's Swift Go platform has achieved significant adoption, with over 600 banks and 400 financial institutions on board. Ripple and Stellar Lumens are acknowledged as leading contributors to cross-border payments and regulatory compliance. Stellar Lumens is also expanding its capabilities to include smart contracts, posing a challenge to Ethereum's dominance in this space.

XLMUSDT Short Idea - Struggling to Maintain Bullish MomentumXLMUSDT has had a strong run up to ~$0.63, as have many other alts, but is now struggling to maintain that bullish momentum.
Looking at a fib retracement view of the bullish push, we can see that the price action has been oscillating between the 0.5 and 0.618 fib levels and has once again been rejected off the bottom of the 0.5 level.
This chart shows a lower timeframe snapshot of that price action rejection off the bottom of the 0.5 fib.
From a bearish push fib retracement view, we can see that there is confluence between the 0.5 bullish fib level and the 0.618 bearish fib retracement region. We can see this level holding well and a potential rejection back down towards another bearish move.
The target for this short idea is a combination of the supply order block level sitting around 0.26, and the -0.618 fib extension level of the bearish fib retracement fib. Stop placement is above the order block flip zone indicated by the yellow box. For lower timeframe traders, a tighter stop could be attempted if you watch the price action closely following a breakdown below the last point of support at 0.38.

XLM/USDTKey Level Zone : 0.38283-0.42128
HMT v2.0 detected. The setup looks promising, supported by a previous upward/downward trend with increasing volume and momentum, presenting an excellent reward-to-risk opportunity.
HMT (High Momentum Trending):
HMT is based on trend, momentum, volume, and market structure across multiple timeframes. It highlights setups with strong potential for upward movement and higher rewards.
Whenever I spot a signal for my own trading, I’ll share it. Please note that conducting a comprehensive analysis on a single timeframe chart can be quite challenging and sometimes confusing. I appreciate your understanding of the effort involved.
If you find this signal/analysis meaningful, kindly like and share it.
Thank you for your support~
Sharing this with love!
HMT v2.0:
- Major update to the Momentum indicator
- Reduced false signals from inaccurate momentum detection
- New screener with improved accuracy and fewer signals

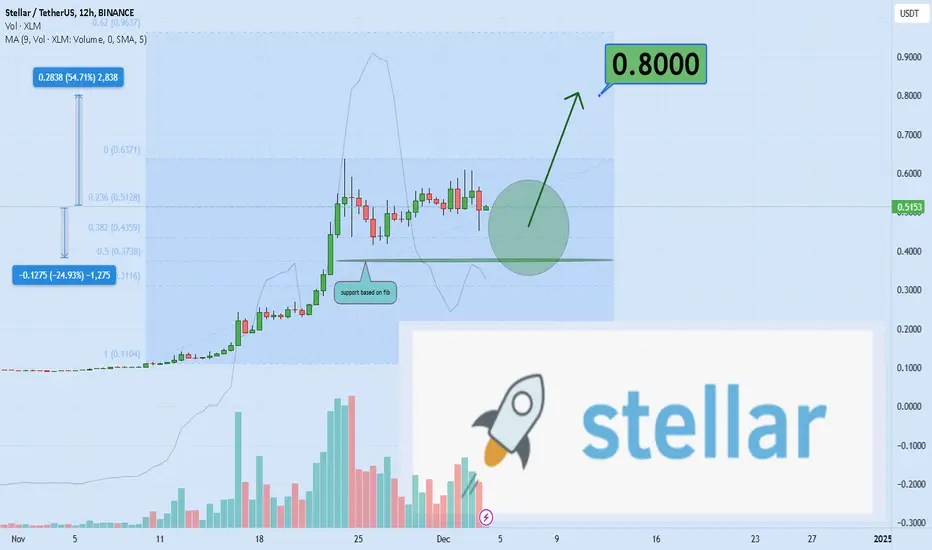
Stellar ( 0.80$ ) is uploading.Hello and greetings to all the crypto enthusiasts, ✌
I aim to provide you with a comprehensive overview of the future price potential for Stellar , 💡
The elevated trading volume, coupled with the technical chart analysis, strongly suggests a minimum upside potential of 50% for XLMUSDT. A significant portion of capital from the previous bull market is still embedded within it, signaling a solid foundation for growth. Should the stock experience an upward movement, it is likely to attract renewed interest from former investors, which could catalyze further investment inflows. 📚🎇
This trend would not only drive price appreciation but also reinforce investor confidence. As a result, XLMUSDT presents a compelling opportunity for both current and prospective investors.
🧨 Our team's main opinion is: 🧨
The high trading volume and technical chart suggest a 50% upside potential , with significant capital from the previous Saudi market still invested. A price rise would likely attract former investors, boosting momentum and investor confidence.
Thank you for your attention. If you have any questions or comments, I’m here to respond to you. 🐋💡

XLMBreaking out with good volume
I expect a retrace to .5-.618 fib levels which match with ema's and that will be my entry for long
Using 20x lev
SL as seen on chart
GOOD LUCK!

XLM Ready for Lift-Off? Wait for Breakout of $0.458!Stellar XLM is still trading in the range zone between $0.40 and $0.46 with the sideways price action.
1. If XLM can break through $0.458 with confidence, bulls might take over and aim for the next resistance at $0.525 and, possibly, higher. That’s where momentum could build up nicely, potentially giving traders something to cheer about (Solid Green Projection).
2. The price is pushing higher. However, if the price stumbles here, we’ll need to watch closely. A minor pullback to $0.431 and a bounce higher would signal buyers still have skin in the game (Dashed Green Projection).
3. On the other hand, if sellers step up and push XLM below $0.399, things could take a bearish turn. A drop toward $0.325 would be the next logical stop, and traders may want to brace for a deeper pullback if that level fails (Red Projection).
In short: $0.458 is the decision zone. A breakout or breakdown will set the tone. Bulls have a target at $0.525 and then $0.593, while bears have their eyes on $0.40—let’s see who blinks first!

xlm long!"🌟 Welcome to Golden Candle! 🌟
We're a team of 📈 passionate traders 📉 who love sharing our 🔍 technical analysis insights 🔎 with the TradingView community. 🌎
Our goal is to provide 💡 valuable perspectives 💡 on market trends and patterns, but 🚫 please note that our analyses are not intended as buy or sell recommendations. 🚫
Instead, they reflect our own 💭 personal attitudes and thoughts. 💭
Follow along and 📚 learn 📚 from our analyses! 📊💡"

XLM/USDT BULL FLAG In this idea I show that XLM is about to pump out of a bull flag and really start taking off. Pretty basic chart here not too much frills or fluff. Hope you get in for the ride much love - ND

XLM's Correction Complete? Targeting $1.10 with Strong MomentumContext and Recent Price Action
XLM has been one of the standout performers in recent months, showcasing impressive bullish momentum:
The November Surge: Starting from $0.084 in early November, XLM skyrocketed to a peak of $0.63 by the end of the month. This remarkable 613% rally highlights intense buying pressure and growing market interest.
The Correction: Following this explosive move, XLM entered a natural consolidation phase, retracing about 40% of its gains. This correction has formed a classic ABC pattern, with the price finding support at $0.35. Such retracements are common after parabolic moves and often set the stage for the next leg higher.
The Bullish Reversal: On Friday, December 13th, XLM has begun to show signs of renewed strength. After revisiting the $0.35 low, the price has rebounded to $0.43, forming a solid bullish engulfing candle on the 6-hour timeframe. This is a strong indication that buyers are regaining control.
Outlook and Target Projection
XLM's structure suggests the corrective phase is nearing its end, paving the way for the next impulse wave. Considering the prior momentum and market conditions, a price target of $1.10 is highly probable within the next 2 weeks.
Key Levels to Monitor
Entry Point:
Current price at $0.43 provides an attractive entry zone for buyers anticipating the next move higher.
Profit Targets:
$0.65 – Retest of the November high.
$1.10 – Extended target based on historical momentum and potential wave projections.
Stop Loss:
Below $0.35 – A breach of this support would invalidate the bullish thesis and could lead to further downside exploration.
Risk-to-Reward Analysis
With the price currently at $0.43:
Downside Risk: Stop loss at $0.35 results in a risk of ~18.6%.
Upside Potential: Targeting $1.10 offers a reward of ~155%.
This gives a compelling risk-to-reward ratio of approximately 8:1.
Conclusion
XLM's recent surge, healthy correction, and current bullish signals create an excellent opportunity for traders. With clear profit targets at $0.65 and $1.10, and a well-defined stop loss at $0.35, this setup offers a strong blend of technical reliability and favorable risk-to-reward dynamics. As XLM completes its consolidation, it seems poised to resume its upward momentum.
Let me know if you’d like further refinements!

XLM is set to retest last swing highBINANCE:XLMUSDT Stellar posted amazing in November and is now trying to hold its gains. The pair is not set to retest the last swing high.
PS. My views only and not financial advice!

It is time to take the trade!"It is time to take the trade! All prices in the blue area are very good for buying. The next target is 1.4 (the next blue area)."

XLM great Buy Opportunity In Here📈 Perfect Bullish Setup For XLM, There Is a Bull Flag Formed At The Chart By The Clear ABC Structure And Wave C Completed At The 1.272% PRZ, Expect a New Bullish Move Here Toward a 0.576$ And 0.814$

XLM Consolidating before Blast OffXLM also known as Stellar was exposed to a less than stellar launch back at the peak of the 2021 bull market.
However, after a massive beat down to les than 10cents, XLM has recently rallied back to all time highs on the notion that American made crypto holders can realize gains without capital gains tax. Not only that, but XLM offers low-cost transfers which allows cross-border transactions between any pair of currencies.
At the moment, I have been watching XLM consolidate after a huge move, which may be a potential signal that this crypto is coiling up for its next move higher. I have taken this long trade at the Value Area Low, and would like to see new all time highs made.
We've also bounced off the anchored vwap from the beginning of this recent pop upwards.
Lets see how this one plays out!

XLMUSDT - ABC correctionXLM had an increase of over +600% in just 20 days followed by a 15-day consolidation phase suggests an exhaustion of the previous trend. The sideways movement aligns with an ABC correction, where wave C is likely unfolding.
Key Levels and Confluence
Trend-Based Fibonacci Extensions:
1:1 Target for Wave C: $0.3873
Key Support Zone:
$0.3725−$0.3873
Market Sentiment
Lack of Volume: Reflects reduced interest from buyers, confirming a bearish bias.
Below Weekly and Monthly Opens: These levels often act as dynamic resistance, showing bears are in control for now.

#XLM/USDT Ready to Soar!$XLM/USDT Long Setup
Pattern: XLM is forming a bullish pennant pattern after a strong upward move, with consolidation narrowing between support and resistance. The 200 EMA is acting as dynamic support, suggesting bullish momentum.
Entry Range: Current price ($0.4896). Entries can be considered between $0.4800 and $0.5000.
Targets:
T1: $0.6400
T2: $0.8000
T3: $0.9400
Stop Loss (SL): Place a stop loss below the pennant's lower boundary at $0.4520 to reduce risk.
DYOR, NFA

XLM Falling Wedge BINANCE:XLMUSDT
🚨 Stellar (XLM) Falling Wedge Pattern Alert! 🚀
📉 XLM is forming a falling wedge pattern on the charts, a strong bullish indicator that often leads to a breakout. Could this be the start of the next upward move?
🔍 What is Happening?
A falling wedge occurs when the price trends lower, creating converging support and resistance lines. This pattern suggests that selling pressure is easing, and buyers may soon take control.
🔗 Key Levels to Watch:
1️⃣ Support Zone:
2️⃣ Breakout Zone: Watch for a breakout above resistance around .
3️⃣ Volume: Rising volume during a breakout could confirm the bullish move.
🌟 Why It Matters:
Falling wedges are often precursors to significant price increases. With Stellar’s fundamentals and utility as a blockchain solution, XLM is one to watch for both traders and investors.
🚀 Stay Ready:
A breakout above resistance could signal a bullish reversal.
Manage your risk with stop-loss levels below the support line.
📊 DYOR (Do Your Own Research) and stay updated—XLM’s next big move might just be starting!
#Stellar #XLM #Crypto #FallingWedge #BullishPattern #ChartPatterns #CryptoTrading #Altcoins

A Daily Crypto Portfolio Pick: XLMUSDT (D1-W)Crypto Pick of the Day: XLMUSDT (D1-W)
Market Overview:
XLM is in a correction phase on the D1 structure and is expected to move into its next growth stage, aligning with the strong uptrend on W-M timeframes.
Trade Plan:
📌 Entry: $0.45–$0.48.
🎯 Target: $0.9 or wait for W timeframe confirmation.
⏳ Horizon: Exit ~5 days after D1 confirms the uptrend.
About My Indicator:
I use RainBow MG3, my custom tool, to identify key trends and entry points.
👉 Want to try it? Contact me!
💡 Disclaimer: Not financial advice. Do your own research.
