Monero a bigger pictureThe circles are where Monero has bounced or fell since January. The surge that may occur, is similar to where it happened in March.
Just a wild perspective. Not financial advice
XMRBTC trade ideas

There is a possibility for the beginning of an uptrend in XMRBTCTechnical analysis:
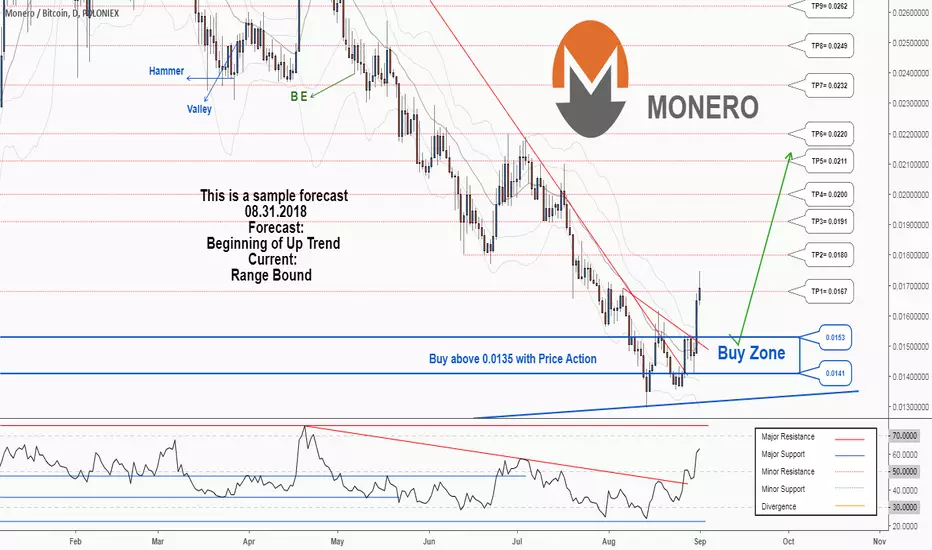
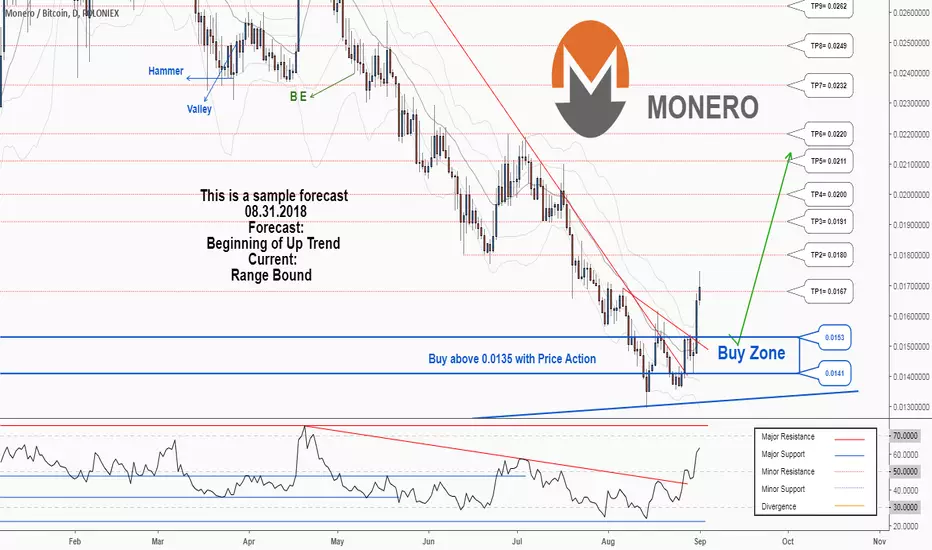
. MONERO/BITCOIN is in a range bound and the beginning of uptrend is expected.
. The price is above the 21-Day WEMA which acts as a dynamic support.
. The RSI is at 62.
. The RSI downtrend & The price downtrend in the daily chart are broken, so the probability of the resumption of an uptrend is increased.
Trading suggestion:
. There is a possibility of temporary retracement to suggested support zone (0.0153 to 0.0141). if so, traders can set orders based on Price Action and expect to reach short-term targets.
Beginning of entry zone (0.0153)
Ending of entry zone (0.0141)
Entry signal:
Signal to enter the market occurs when the price comes to "Buy zone" then forms one of the reversal patterns, whether "Bullish Engulfing" , "Hammer" or "Valley" in other words,
NO entry signal when the price comes to the zone BUT after any of the reversal patterns is formed in the zone.
To learn more about "Entry signal" and the special version of our "Price Action" strategy FOLLOW our lessons:
Take Profits:
TP1= @ 0.0167
TP2= @ 0.0180
TP3= @ 0.0191
TP4= @ 0.0200
TP5= @ 0.0211
TP6= @ 0.0220
TP7= @ 0.0232
TP8= @ 0.0249
TP9= @ 0.0262
TP10= @ 0.0273
TP11= @ 0.0304
TP12= @ 0.0320
TP13= Free
There is a possibility for the beginning of an uptrend in XMRBTCTechnical analysis:
. MONERO/BITCOIN is in a range bound and the beginning of uptrend is expected.
. The price is above the 21-Day WEMA which acts as a dynamic support.
. The RSI is at 62.
. The RSI downtrend & The price downtrend in the daily chart are broken, so the probability of the resumption of an uptrend is increased.
Trading suggestion:
. There is a possibility of temporary retracement to suggested support zone (0.0153 to 0.0141). if so, traders can set orders based on Price Action and expect to reach short-term targets.
Beginning of entry zone (0.0153)
Ending of entry zone (0.0141)
Entry signal:
Signal to enter the market occurs when the price comes to "Buy zone" then forms one of the reversal patterns, whether "Bullish Engulfing" , "Hammer" or "Valley" in other words,
NO entry signal when the price comes to the zone BUT after any of the reversal patterns is formed in the zone.
To learn more about "Entry signal" and the special version of our "Price Action" strategy FOLLOW our lessons:
Take Profits:
TP1= @ 0.0167
TP2= @ 0.0180
TP3= @ 0.0191
TP4= @ 0.0200
TP5= @ 0.0211
TP6= @ 0.0220
TP7= @ 0.0232
TP8= @ 0.0249
TP9= @ 0.0262
TP10= @ 0.0273
TP11= @ 0.0304
TP12= @ 0.0320
TP13= Free
Monero's correction is finishedAs correctly analyzed, Monero broke above the trend line resistance and corrected higher. We wrote on Aug 27 that "...the 100 DMA is approaching the horizontal resistance and IF Monero gets eventually there, we may have a confluence of two huge resistance players - horizontal line and 100 DMA, around 0.01770". As a result, the coin did exactly the same, moreover, it pushed even higher to 0.01930 and got almost to the second zone of resistance - 38.2% Fibonacci support. The coin created a shooting star candlestick formation which is a bearish sign. This formation prompted a retracement and the coin is now trading back below the 100 DMA and a horizontal resistance, which ultimately means that correction is finished and we are again looking to test the major support zone between 0.01300 - 0.014000. We are looking for a test of that zone once again, with a higher probability now to make a break. If this happens, look for a quick trip to the next support zone around 0.01100.

$XMRBTC ready for new highsAbout to break out of the Bullflag.
Buy now or on rebound for confirmation.


Monero at a Turning PointDaily, #BTCXMR.
Monero attempting to hold the 10 day here with the 20 day about to cross over the 50 day.

MONERO is losing your BTCXMRBTC has Elliott Waves (12345-ABC) with Fibonaccci lvls and target zones of take profit. Have a nice trade !

OUCH MOehNERO!We will be back to accumulating soon! I still think .012BTC is on the way but .013 is bargain when these little pumps happen now and then.


Monero Battling With Strong Resistance: A Big Test For The BullsLook at the 1D XMR/BTC we can see that the current uptrending asset has met a strong resistance (white dotted line) which is preventing it from breaking cleanly through the resisting Kumo, on the Ichimoku indicator.
CMF is showing increased buying pressure but now the asset has spilled into the overbought region on the RSI.
Bulls will need to drive beyond this resistance and potentially find support on top of it, to refuel before attempting another impulse move.
For now there is speculation that this pump is being orchestrated by an old Silk Road wallet trading out of BTC into XMR. If this is true then it's likely that Monero will P&D back to lower support regions, in the absence of genuine sentiment.


XMRBTC (D): Monero forecast ...an interesting link may be. maybe you already know the study. in any case we find some interesting aspects there.
research.bloomberg.com
Let's see what happens. Happy trading. :-)


Great Time To Accumulate MoneroMonero looks like a good buy at the moment. Almost completed the market cycle and building a falling wedge. Stoch is oversold. Might take a while to get started in this depressing market, but a good spot to accumulate.


Monero - Week Sale Target(I'm new just learning)
Sale target for this week for Monero. This comes from a bull trend similar to the one in July.
Comments Welcome.

XMR/BTC monero monero ! :))Hello all !
Im neutral-bearish on monero at this moment.
Monero is a difficult chart for daytrading and so lets see how it goes in the next months , as you can see we had a double botton on august and october, range 0.011 , worked very well giving 200% roi both , will the story repeats? maybe.. :)
So what I will do is set some orders between previous double botton range , and some at 0.00974.
no chart patterns here so well nothing much to project in this chart :)
Current price : 0.0151
have good day!

MONERO / BITCOIN Reversal of primary bear trend, bullish! ]
looking at the chart it looks like the primary trend could be reversing soon. Volume has dried up significantly from the past and if enough volume is present to confirm the price action and continues to make higher highs and higher lows It could be a very profitable swing. I don't trade forex or any currency mostly stocks so this is my technical analysis. The measuring objective I determined by taking the greatest vertical displacement from the trend line to the price. This should be considered a minimum expectation scenario if the trend reverses. RSI looks a little overbought may see some retracement back to the extended trend line. If it breaks below the extended trend line then this should be considered bearish and a warning to further consolidation or continuation.

Where's the volume at? Best explanation gets a prizeI have a theory but I want to hear yours. Best answer gets a prize in XMR. (if that's okay? i didn't read rules)
