XMR / Monero 2021 Cycle Correlating to Bitcoin 2017 CycleKRAKEN:XMRUSD
Today we will be exploring the correlations between the 2017 Bitcoin market cycle and the current Monero market cycle.
Below is a chart showing the Fibonacci retracement from the previous Bitcoin market cycle top to the 2017 market cycle top. It is important to note here that up to the Fibonacci 0.236 level is the accumulation zone for the Bitcoin 2017 market cycle.
For both Bitcoins 2017 market cycle and Monero's current cycle we see an accumulation at the 0.236 before breaking out into the bull market. If Monero follows the same trend as the 2017 Bitcoin cycle we will see a market cycle top at the 23 Fibonacci level. The posted fractal overlay on the posted chart shows the continuation of Monero's cycle past 0.618 Fibonacci level if it continues to correlate with Bitcoins 2017 cycle.
XMRUSD trade ideas

XMRUSD MoneroMonero is working on its way up to catch up with a previous ATH. Current ascending bull flag and overall uptrend proves that it will get there without difficulties. Possible cup and handle formation in the future. After that off we go.


Monero (XMRUSD) – Coin of the WeekMonero was introduced in 2014 with a single goal: to enable transactions to be conducted privately and anonymously. Even though it's a common misconception that BTC may hide a person's identity, since blockchains are transparent, it's always simple to track transfers back to their original source. XMR, on the other hand, is designed to hide both senders and receivers using sophisticated cryptography.
Technically, XMR broke the resistance area at $288 USD and is making new highs with a diverging RSI, sign that tells us that a bigger correction is imminent. For this pair we have 2 working scenarios: one is a consolidation in this area marked with the blue arrow on the chart and the second one a bigger down move that could reach the minor support, the blue trendline or the major support. We advise caution.
Trade with care.
Best regards,
Financial Flagship
Disclaimer: The analysis provided is purely informative and it should not be used as financial advice. Remember that you need a plan before you start trading; so, take this knowledge and use it as a guidebook that will ultimately help you understand the market and easily predict your next move.


PATIENCE EQUALS PROFITSMind set is everything. Trusting your mark ups will play a major roll in the ability to be able to hold your trade for a period of time. This was a four day trade. Despite some pull back, I trusted my mark ups and the market gave me just what i wanted.

Pivot stop out of highs is nice exitEXIT Conditions ( termination conditions)
went flat XMR on a double top pivot stop out of the yearly high and subsequent reversal.
When i teach day traders to look for reversals this is one of the key pattern.

Monero, some thoughtsJust an idea, my personal opinion
Are we approaching a new steeper Uptrend Channel on XMR? ;)
If so, follow the arrows!
LENDING:
Celsius Network - Download the App to earn Interest in Crypto, located in USA:
celsiusnetwork.app.link
Bitrue - Leading in Crypto Lending, located in Singapore:
www.bitrue.com
FREE BASIC INCOME:
A Basic Income Coin + Wallet accessable for everyone via Webbrowser, made by eToro CEO:
wallet.gooddollar.org
CRYPTO EXCHANGES:
Bitfinex, one of the biggest Exchanges in Asia, Lending, Spot Trading, Margin Trading and Futures:
www.bitfinex.com
Come to Bittrex - lots of Coins to earn there, located in Liechtenstein:
bittrex.com
3x Long Token is tradable on Poloniex, located in USA-Delaware:
you get 10% of my trading fees and I 20% of yours
poloniex.com
***ALL MENTIONED IDEAS ARE MY OWN OPINION AND ARE NOT A TRADIGN ADVICE***
***PLEASE FOLLOW AND LIKE IF YOU LIKED THIS IDEA!!****


XMRUSD Trend Continuation PatternIf you like the content and are getting value out of it, please make sure to hit that like button and leave a comment. Also, if you're interested in seeing more of my analysis don't forget to follow me, and make sure to check out my YouTube Channel (link can be found on my profile page) for more in-depth analysis.
Welcome back for some more chart analysis practice. I found another trend continuation pattern opportunity here on XMRUSD. Here as you can see, the market broke above the previous highs of 243.344 and is now retracing back into a 0.618 Fib retracement level, which gave me my entry @ 244.287. Since my entry got hit, I put my stop loss 10 pips below the most recent low @ 229.178, and my target @ 261.366.
Ultimately guys, while trading can be very simplistic at times, it is genuinely a hard skill to master, and if you are serious about becoming a consistently profitable trader, then you need to master chart analysis. So, take it seriously, get out there and practice it every day.
Disclaimer: This is not a recommendation or an endorsement to buy, sell, or take any positions of any kind, in any market. This is for educational purposes only. I am not taking this trade in real life, and I have not back-tested this particular strategy on this currency pair, so I really don't know how this type of trading strategy will work on this currency pair. That being said, never trade anything you haven't back-tested on your own. Don't trade a strategy just because someone tells you it's a good strategy, always back-test the strategy in question over historical data before trading it with real money. Trading a strategy that has not been back-tested is the equivalence of gambling your money away, or trying to shoot a target when its pitch-black outside. You work hard for your money, so don't throw it away.


Monero (XMR) Pump or Retrace? Approaching Potential ResistanceThanks again HUmair for the suggestion.
We are looking at touching a critical fib/structural level as potential resistance. If we cannot break past we are likely to see a retracement to the next major fib zone prior to another push upward.
GOOD LUCK and use proper risk with stop losses.

XMR to retest 377? Trying to retest previous high of around $275. Breakout to this could retest $377.
Support is seen at $175. Trade Cautiously.


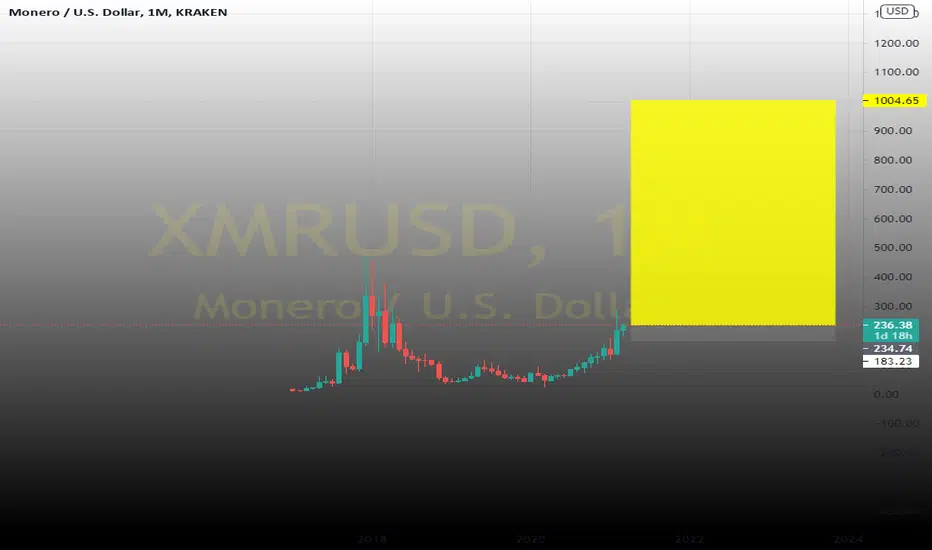
XMRUSD Bullish Until 1000$Monero have been showing heavy bullish signs. I do believe we could see a heavy pump to 1000$. As i believe its heavy undervalued and just had a hard fork in October. Show your appreciate in the comment section and show your support.
XMRUSD Possible Runner UpMonero has already broke out of a consolidation funnel and will probably be one of the first coins to continue trending upwards in the forth coming altcoin rally.

XMRUSD Trend Continuation PatternIf you like the content and are getting value out of it, please make sure to hit that like button and leave a comment. Also, if you're interested in seeing more of my analysis don't forget to follow me, and make sure to check out my YouTube Channel (link can be found on my profile page) for more in-depth analysis.
Welcome back for some more chart analysis practice. I found another trend continuation pattern opportunity here on XMRUSD. Here as you can see, the market broke below the previous lows of 211.60 and is now retracing back into a 0.618 Fib retracement level, which gave me my entry @ 220.19. Since my entry got hit, I put my stop loss above the most recent high @ 232.04, and my target @ 205.86.
Ultimately guys, while trading can be very simplistic at times, it is genuinely a hard skill to master, and if you are serious about becoming a consistently profitable trader, then you need to master chart analysis. So, take it seriously, get out there and practice it every day.
Disclaimer: This is not a recommendation, advice or an endorsement to buy, sell, or take any positions of any kind, in any market. This is for educational purposes only. I am not taking this trade in real life, and I have not back-tested this particular strategy on this currency pair, so I really don't know how this type of trading strategy will work on this currency pair. That being said, never trade anything you haven't back-tested on your own. Don't trade a strategy just because someone tells you it's a good strategy, always back-test the strategy in question over historical data before trading it with real money. Trading a strategy that has not been back-tested is the equivalence of gambling your money away, or trying to shoot a target when its pitch-black outside. You work hard for your money, so don't throw it away.

