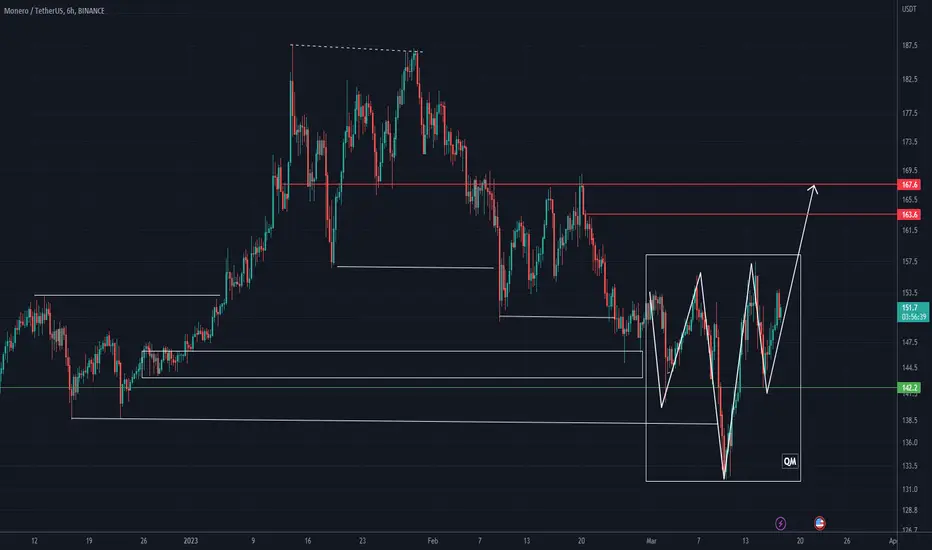
xmr have a bullish qmHi, dear traders. how are you ? Today we have a viewpoint to BUY/LONG the XMR symbol.
For risk management, please don't forget stop loss and capital management
When we reach the first target, save some profit and then change the stop to entry
Comment if you have any questions
Thank You
XMRUSDT trade ideas
#Monero Crashes After Spinning Tops Formation, Resistance At $16Past Performance of Monero
Monero is under pressure, dropping five percent in the last trading day. From the daily chart, XMR is reacting strongly from last week’s highs at around $165. After a spinning tops formation, the coin retraced yesterday, printing a bearish engulfing pattern, signaling weakness. Based on this, there could be a confirmation today, heaping more pressure on the coin.
#Monero Technical Analysis
After a spinning tops formation, XMR is down at spot rates. It looks likely for bears to flow back, pushing the coin deeper in red. Therefore, since yesterday’s bar was bearish and engulfing, traders might look for entries on every attempt higher towards $165. The immediate target would be $145 and later March lows at $130 if bears press on. On a more optimistic outlook, the trend will resume should prices break above $165, reversing recent losses with expanding participation levels. In that case, XMR may float to January highs at around $180.
Past Performance of #XMR
Asset prices are under pressure across the board, and XMR is no exception. From the daily chart, buyers will flow back if there is a breakout above the spinning tops of the end of last week with rising volumes. If not, bears of yesterday may force the coin lower this week.
Resistance level to watch out for: $165
Support level to watch out for: $145
Disclaimer: Opinions expressed are not investment advice. Do your research.

Monero longMonero bounced off the ascending trendline and bounced off the support level. Bullish movement to resistance level at 165.5 is expected to happen.

XMRUSDT - testing an important levelHello everyone. According to XMRUSDT, the picture is more joyful than for the rest of the coins. They formed the bottom for a long time, about a month. And after that, we finally broke through level 155. At the moment, the whole market has gone down, but there are good chances to test the level and go further to 167. We put the stop at 153.5.

XMR/USDT$XMR
Green triangle just broke out above, if you look at the blue lines, it is a descening channel which is a bullish reversal pattern, first target is around the resistance of the channel, I have a feeling that its going to continue to pump and flip the descending channel very easily! Overall I am bullish on monero because as concerns about privacy grow, this privacy-focused coin is becoming more important than ever. With solid technology, transactions that can't be tracked, and a dedicated dev team, #Monero is ready to reach new all time highs
Get ready to reach the $5k mark!


XMRUSDT - not an usual BITCOIN FollowerXMR is a privacy coin and has its own whales who are not really interested in what happens to BITCOIN as it has it own uses.
Recently, its MACD came above the avg line and looking to go higher to make a bearish cross later in the year... we do not know how long can it go. But we have a near (highly probable) target (200$ - 205$) in our sight.
Entry can be taken from 160$ - 175$
SL @ 155$
let's see what happens in the future and in days to come.
Good luck.

XMR/USDT 1DAY UPDATE BY CRYPTO SANDERS !Hello, welcome to this XMR/USDT 1DAY chart update by CRYPTOSANDERS.
I have tried to bring the best possible outcome to this chart.
Show some support, hit the like button, and follow and comment in the comment section. this motivates me to bring this kind of chart analysis on a regular basis.
CHART ANALYSIS:-Monero (XMR) has been one of today’s biggest gainers, with prices climbing to a four-week high.
Following a low of $152.16 on Thursday, XMR/USD raced to a peak of $163.10 earlier in the day.
As a result of the move, XMR climbed to its strongest point since February 20, when the token reached a peak of $168.70.
Looking at the chart, the move came as monero rose beyond a key resistance level at the $155.00 mark.
Earlier momentum has somewhat eased, which comes as the 14-day relative strength index (RSI) collided with a ceiling at 58.00
At the time of writing, the index is tracking at 58.84, with XMR marginally lower than its earlier high. It is now trading at $160.65.
This is not a piece of financial advice.
Hit the like button if you like it and share your charts in the comments section.
Thank you

Monero Weekly View - March 2023Hello Guys, Weekly Analysis is on the MATICUSDT Symbol in a 1H Time frame, I Hope it Will be Useful for You, Don't Forget to Like, Follow, Comment

XMR long potentialForked with pivot at 09-03-2020 according to the existing data, Median Line tested, meaning the fork is valid, i've used the line to measure the exact move. Expecting the Median Line to push the price up, Breaker to be tested at 388, with FVG level.
We might see ATH in the upcoming months.
NFA

XMR/USDT - Monero: Resistance_Breakout_Confirmation◳◱ A Resistance Breakout and Confirmation has been detected on the $XMR / $USDT chart. The price has broken above a key resistance level and has been confirmed by a strong candle, indicating a potential bullish trend. The next resistance key levels are located at 160.5 | 167.8 | 184.2, and the major support zones can be found at 144.1 | 135 | 118.6. Consider entering a trade at the current price zone of 160.1 and targeting higher levels.
◰◲ General info :
▣ Name: Monero
▣ Rank: 25
▣ Exchanges: Binance, Kucoin, Bybit, Huobipro, Gateio, Poloniex
▣ Category/Sector: Payments - Currencies
▣ Overview: Aimed at privacy-preservation and fungibility, Monero is a Bytecoin code fork providing anonymous value transfer through ring signatures, stealth addresses, confidential transactions, and bulletproofs. Monero offers anonymity by default in contrast to the optional privacy preserving functionalities of its peers. In pursuit of decentralization Monero continually changes its proof-of-work algorithm in order to prevent ASICs from dominating and centralizing the mining process.
◰◲ Technical Metrics :
▣ Mrkt Price: 160.1 ₮
▣ 24HVol: 21,226,745.269 ₮
▣ 24H Chng: 4.777%
▣ 7-Days Chng: 3.18%
▣ 1-Month Chng: 0.75%
▣ 3-Months Chng: 10.72%
◲◰ Pivot Points - Levels :
◥ Resistance: 160.5 | 167.8 | 184.2
◢ Support: 144.1 | 135 | 118.6
◱◳ Indicators recommendation :
▣ Oscillators: NEUTRAL
▣ Moving Averages: STRONG_BUY
◰◲ Technical Indicators Summary : BUY
◲◰ Sharpe Ratios :
▣ Last 30D: -0.70
▣ Last 90D: 0.75
▣ Last 1-Y: 0.12
▣ Last 3-Y: 0.83
◲◰ Volatility :
▣ Last 30D: 0.53
▣ Last 90D: 0.51
▣ Last 1-Y: 0.78
▣ Last 3-Y: 0.95
◳◰ Market Sentiment Index :
▣ News sentiment score is N/A
▣ Twitter sentiment score is 0.55 - Bullish
▣ Reddit sentiment score is 0.63 - Bullish
▣ In-depth XMRUSDT technical analysis on Tradingview TA page
▣ What do you think of this analysis? Share your insights and let's discuss in the comments below. Your like, follow and support would be greatly appreciated!
◲ Disclaimer
Please note that the information and publications provided are for informational purposes only and should not be construed as financial, investment, trading, or any other type of advice or recommendation. We encourage you to conduct your own research and consult with a qualified professional before making any financial decisions. The use of the information provided is solely at your own risk.
▣ Welcome to the home of charting big: TradingView
Benefit from a ton of financial analysis features, instruments and data. Have a look around, and if you do choose to go with an upgraded plan, you'll get up to $30.
Discover it here - affiliate link -

XMRUSDT breaking through the long-awaited level?According to XMRUSDT, the thoughts are as follows: we have been hitting the level of 153 for a long time. We have formed a “head and shoulders” pattern and the trend line is pressing the whole thing. Therefore, you can try Long with the target of 166, stop behind the trend line 149.

XMRUSDT - Week5 - Long with 2x to 4x - Inverse Head and ShoulderXMRUSDT - Week5 - Long with 2x to 4x - Inverse Head and Shoulder
Also it shows double bottom.

XMR IS BEARISHHi, dear traders. how are you ? Today we have a viewpoint to SELL/SHORT the XMR symbol.
For risk management, please don't forget stop loss and capital management
When we reach the first target, save some profit and then change the stop to entry
Comment if you have any questions
Thank You

XMR - Preparing a move up
We have the convergence of an ascending trendline and a strong support in the 135 region. We have also broken a smaller timeframe descending trendline in green.
I expect short term price recovery to test 167 resistance. A break could take us all the way to 210 initially (but still too early to tell, let´s see what price tells us).

XMR: Channel Down Breakout!Monero (XMR) technical analysis:
Trade setup : Bullish breakout from Channel Down pattern as well as above 200-day moving average and $150 resistance could be a sign of trend reversal with upside potential to $160 or higher.
Trend : Downtrend on Short- and Medium-Term basis and Uptrend on Long-Term basis.
Momentum is Mixed as MACD Line is above MACD Signal Line (Bullish) but RSI ~ 50 (Neutral).
Support and Resistance : Nearest Support Zone is $140, then $120. The nearest Resistance Zone is $150, then $160, and $190.

$XMR - Long Trade Set-Up$XMR - Long Trade Set-Up
Entry Conditions:
| Flipped key resistance to support and bounced
| Bounced off 20ma 1hr
| Bounced from Weekly Pivot
| Momentum Signal
| ADI and Momentum Turning Positive

Monero Weekly View - March 2023Hello Guys, Weekly Analysis is on the XMRUSDT Symbol in a 1H Time frame, I Hope it Will be Useful for You, Don't Forget to Like, Follow, Comment

$XMR/#USDT [#Monero]: Resistance_Breakout_Confirmation◳◱ A Resistance Breakout and Confirmation has been detected on the $XMR / $USDT chart. The price has broken above a key resistance level and has been confirmed by a strong candle, indicating a potential bullish trend. The next resistance key levels are located at 159.7 | 169.6 | 193.3, and the major support zones can be found at 136 | 122.2 | 98.5. Consider entering a trade at the current price zone of 148.6 and targeting higher levels.
◰◲ General info :
▣ Name: Monero
▣ Rank: 26
▣ Exchanges: Binance, Kucoin, Bybit, Huobipro, Gateio, Poloniex
▣ Category/Sector: Payments - Currencies
▣ Overview: Aimed at privacy-preservation and fungibility, Monero is a Bytecoin code fork providing anonymous value transfer through ring signatures, stealth addresses, confidential transactions, and bulletproofs. Monero offers anonymity by default in contrast to the optional privacy preserving functionalities of its peers. In pursuit of decentralization Monero continually changes its proof-of-work algorithm in order to prevent ASICs from dominating and centralizing the mining process.
◰◲ Technical Metrics :
▣ Mrkt Price: 148.6 ₮
▣ 24HVol: 12,468,463.506 ₮
▣ 24H Chng: 1.157%
▣ 7-Days Chng: 4.87%
▣ 1-Month Chng: -5.88%
▣ 3-Months Chng: 5.06%
◲◰ Pivot Points - Levels :
◥ Resistance: 159.7 | 169.6 | 193.3
◢ Support: 136 | 122.2 | 98.5
◱◳ Indicators recommendation :
▣ Oscillators: SELL
▣ Moving Averages: STRONG_BUY
◰◲ Technical Indicators Summary : BUY
◲◰ Sharpe Ratios :
▣ Last 30D: -0.97
▣ Last 90D: 0.34
▣ Last 1-Y: 0.13
▣ Last 3-Y: 0.84
◲◰ Volatility :
▣ Last 30D: 0.55
▣ Last 90D: 0.50
▣ Last 1-Y: 0.78
▣ Last 3-Y: 0.96
◳◰ Market Sentiment Index :
▣ News sentiment score is N/A
▣ Twitter sentiment score is 0.55 - Bullish
▣ Reddit sentiment score is 0.79 - V. Bullish
▣ In-depth XMRUSDT technical analysis on Tradingview TA page
▣ What do you think of this analysis? Share your insights and let's discuss in the comments below. Your like, follow and support would be greatly appreciated!
◲ Disclaimer
Please note that the information and publications provided are for informational purposes only and should not be construed as financial, investment, trading, or any other type of advice or recommendation. We encourage you to conduct your own research and consult with a qualified professional before making any financial decisions. The use of the information provided is solely at your own risk.
▣ Welcome to the home of charting big: TradingView
Benefit from a ton of financial analysis features, instruments and data. Have a look around, and if you do choose to go with an upgraded plan, you'll get up to $30.
Discover it here - affiliate link -

XMR_USDTMonero has broken the downtrend. If it stabilizes above the $154.5 resistance, it's a good buy
Like and comment ❤️🚀

Soon everyone will know that you are one of the besthi dear traders
With regard to the debts of the US government. They put a lot of pressure on crypto, but the only thing they have always been fighting with and always losing is Monero
According to Biden's tax, soon all the money will go to Monroe
see this price action S level
good luck

#Monero Upsides Limited By The 20-day MA and $155Past Performance of Monero
Like Bitcoin, the selloff in Monero was steep. However, the coin is higher at spot rates but capped below the dynamic resistance line, the middle BB. From the XMR candlestick arrangement, the primary support is at $130, which is the 78.6% Fibonacci retracement level.
#Monero Technical Analysis
The path of least resistance, at least in the short term, is bearish. Even so, with XMR up roughly 6% over the weekend, the trend could quickly shift. Notice that prices are rebounding from a critical support level. If there is confirmation today and prices edge higher, building on March 12 gains, XMR may spring towards $155 and later $170. This preview is only valid as long as there are rising trading volumes accompanying the leg up. Meanwhile, any drop below $130 at the back of relatively high trading volumes will invalidate the bullish preview, setting the base for a selloff towards $120.
What to Expect From #XMR?
Technically, Monero is bullish. But, how prices react in the short term depends on whether XMR stays above $130. If there is a breakout above $155 and the middle BB, there might be a reprieve, forcing the coin toward Q1 2023 highs.
Resistance level to watch out for: $155
Support level to watch out for: $130
Disclaimer: Opinions expressed are not investment advice. Do your research.

Xmr analysis forming descending channel in h2 timeframe incase of breakout expecting 20 to 25% bullish move
wait for confirmed breakout for entry
