Monero xmrCurrency looks good, one buy step at current price ($ 225 to $ 250) in case of falling from the support line The buy range in the next steps is marked in the chart
XMRUSDT trade ideas
XMR Update 1XMR is in a bad tension between the upper and lower sides of the triangle! Depending on how it goes out , the next trend (Up Or Down) would be predictable. Anyway , its not a good time for trade.
Note : Do your own analyze before taking any decision.


🔥 XMR Bearish Channel ContinuationOver the last few days, XMR has produced a bearish channel on its chart. With BTC slightly reversing in the last couple of hours, a lot of alts are seeing a bounce right now.
In my view, this bounce is temporary, we will soon continue the down trend as per my most recent BTC analysis. The top of the channel would be a great place to enter any potential shorts on this pair.
Trade with caution. BTC can move very erratic and will take the market with it, any direction.
Happy trading!


XMRusdt - BinanceXMRusdt - Binance
XMRusdt - Binance
ENGLISH
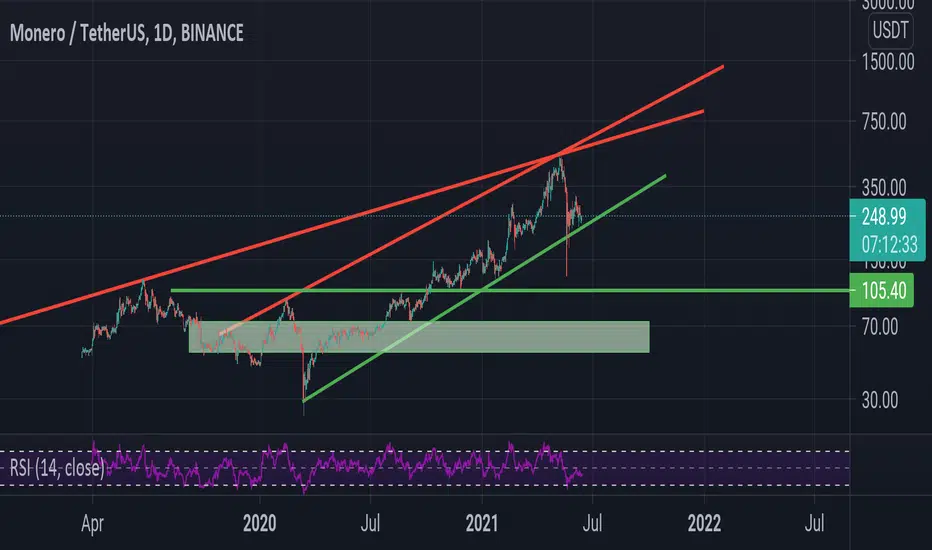
on the weekly candels we see a general uptrend, support with volume.
Since the recent lows, we notice that the general price structure is in an upward channel (LOGscale)
Every time we hit the bottom of the channel line we see a remarkable increase in volume, which in the past has led to further upward movement. with this in mind we choose our friend the trend.
setup 1 is taken from a daily candle frame.
we spot an inner uptrend, which has broken up a symmetrical triangle paternwise.
Most ideal entry has already happened today, but with a rematch around 272 - 257 an entry can be found
our stop loss is below the trendline .
Entertainment: 276.12 - 258.01 - 264
stop loss: 246.71
tps
1 326.44 - 370.58 - 415.43 - 475.94 - 98.72
DUTCH
op de weekelijkse candels zien we een algemene uptrend, ondersteun met volume.
Sedert de recent lows, merken we hierop dat de algemene prijsstructuur zich in een opwaarts kanaal (LOGscale)
Telke male we die onderkant van de kanaal lijn raken zien we opmekelijke volume toename, wat in het verleden steeds tot een verder upwaartse beweging bracht. met dit in het achterhoofd kiezen we voor onze friend the trend.
setup 1 is genomen vanuit een daily candle frame.
we spotten een inner uptrend, die paternwise een symmetrical triangle upwaarst heeft gebroken.
Meest ideale entery is reeds gebeurt vandaag, maar bij een herkanssing rond 272 - 257kan een entery gevonden worden
onze stoploss staat onder de trendline .
Entery: 276.12 - 258.01 - 264
stoploss: 246.71
tp's
1 326.44 - 370.58 - 415.43 - 475.94 - 98.72


XMR/USDT (BINANCE)Monero went on a bearish stretch, after the appearance of a Harami Pattern (marked on red) the price has began entering a correction phase where right now is going for a breakout possibly to the upper side, the price breaking above the moving average shows signs of a possible reversal happening, staying above that pink EMA200 indicates that prices has found support and demand. MACD shows momemtum to the upper side as the price keeps climbing. Stochastic still below overbought levels. Strongly suggest watching those 5min candles and 15min candles to get the most accurate information to confirm the breakout.

🔥 XMR In A Pennant: UpdateIn my last XMR analysis I argued that XMR would be following the pattern in the near future, which it did. Take a look at my previous analysis for reference:
Currently, XMR is on the verge of breaking out on the upside on this pattern. BTC's bullishness is definitely helping crypto here. In case BTC stays bullish for a couple of days, we might see some very nice gains in the altcoin market.
Main target for XMR is currently $320.
Happy trading!

XMRUSDT is testing the parabolic support 🦐XMRUSDT is testing the parabolic support and the daily support as well. IF the price will have a breakout from 4h resistance, According to Plancton's strategy (check our Academy), we can set a nice order
–––––
Follow the Shrimp 🦐
Keep in mind.
🟣 Purple structure -> Monthly structure.
🔴 Red structure -> Weekly structure.
🔵 Blue structure -> Daily structure.
🟡 Yellow structure -> 4h structure.
⚫️ Black structure -> <4h structure.
Here is the Plancton0618 technical analysis, please comment below if you have any question.
The ENTRY in the market will be taken only if the condition of the Plancton0618 strategy will trigger.

XMR in watch listXMR is good to be n watch list. It is talented now to be a market star! But ... We should stay and see...
Note : Do Your own analysis before trading.


🆓Monero (XMR) May-31 #XMR $XMRXMR is still stable above 240$ zone and it could reach 320$ and 400$ zone in this June. But if it loses this 240$ zone, it will fall down to 160$ zone
📈BUY
- Buy : 235-245$. SL if B
- Buy : 315-325$ if A. SL if B
📉SELL
- Sell : 315-325$. SL if A
- Sell : 390-410$. SL if A
♻️BACK-UP
- Sell : 235-245$ if B. SL if A
- Buy : 155-165$. SL if B
❓Details
🕯Timeframe : 1 Day
📈Red Arrow : Main Direction as BUY and SELL section
📉Blue Arrow : Back-Up Direction as BACK-UP section
🟩Green zone : Support zone as BUY section
🟥Red zone : Resistance zone as SELL section
🅰️A : The Close price of candlestick is Above the zone
🅱️B : The Close price of candlestick is Below the zone

🔥 XMR In A Pennant: Break Out ImminentJust like BTC (and other cryptos) XMR is currently trading in a pennant formation. Since XMR is currently trading at the bottom of the pennant, there's a reasonable chance that the price shall reverse soon towards the pennant's resistance, assuming BTC won't fall too much.
In case of a bearish break out, the main target would be $200. For a bullish break out, that would be $330.
All things considered, XMR has been performing quite well since the BTC dump. In case BTC will get bullish again, XMR will be one of my top picks.
Happy tr


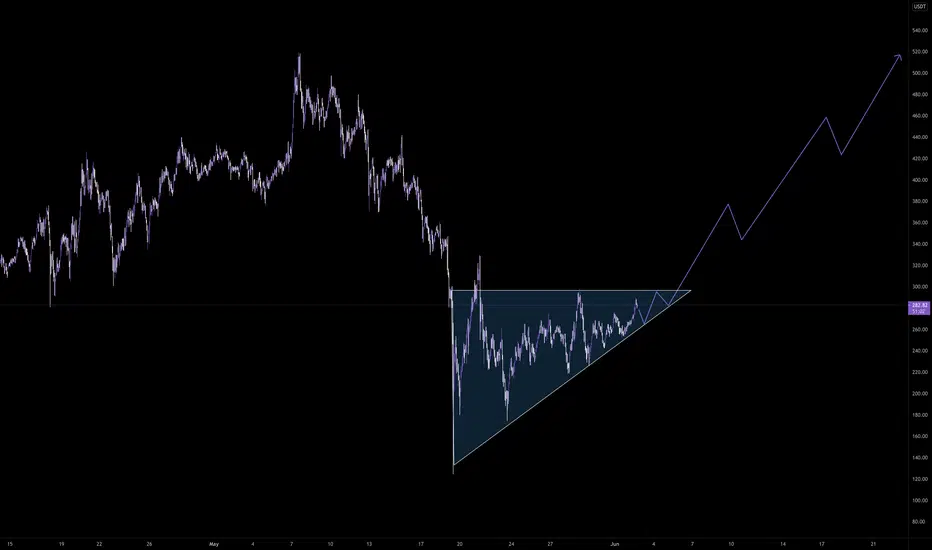
XMRUSDTXMRUSDT, Ascending triangle in the making.
Wait for the breakout, gonna rocket soon when bitcoin decide what to do.


XMRUSDT - 4HXMR need to set a 4 Hour higher low. After the triangle break we pulled back now to the break out zone.
If this zone holds as support we might see continuation to the upside.
For every new follower i will add a new idea :)

XMRUSDTHello to you all. Mars Signals team wishes you high profits at all times.
The price is in a triangle and wants to test the resistance. But if the price goes out of any direction, the trend will move in that direction. We have specified it for you
Warning: This is just a suggestion to you and we do not guarantee profits.
Wish you luck!

XMRUsdr easy profir and gin up fastthis is not pro idea pls check other idea first
this pull back on 281.61 and again goin top . start later wave
support is :
281.61
250.59
234.77
resisdance is :
315.38
targets is:
371.87
460.05
597.24
685.38
GL guys

