XMRUSDT trade ideas

Monero(XMR): We Will Sell Soon! The XMR/USDT market is displaying some dramatic price action. The recent sharp decline suggests a significant urge for downward movement. Despite these bearish liquidity moves we are having on the market, the price of XMR has re-tested the major resistance (which once was broken and we had a nice fakeout).
If this retest turns out to be a fakeout, it indicates that sellers are still in control, and we could expect further downside towards the $157.51 support level. This bearish scenario aligns with the recent drop and will be further substantiated if the price fails to reclaim higher levels soon.

XMRUSDT Sell LimitMonero H1 chart. We have strong demand zone. Risk reward 1:3 (or more) . Bears are strong and 175 level is good level to enter short.

MONERO Rockets Forward: Bullish Cup and Handle Pattern 🚀 !In the dynamic world of crypto, Monero (XMR) has recently unfolded a powerful chart pattern that has traders buzzing with excitement. The emergence of a Bullish Cup and Handle on the daily timeframe signals the potential for a significant upward move, with a target set at $188.
Chart Analysis: Cup and Handle Unleashed
Bullish Cup and Handle Formation:
Monero has gracefully crafted a classic Cup and Handle pattern on the daily chart.
The Cup and Handle is a potent bullish continuation pattern, suggesting a potential surge in price.
Pattern Breakout:
The Handle portion of the pattern has convincingly broken out, symbolizing a shift in market sentiment.
This breakout has already breached the level of the Handle, setting the stage for a broader upward trajectory.
Anticipated Scenarios: The Journey to $188
Targeting $188:
The Cup and Handle pattern implies a target, and in this case, it points to the ambitious level of $188.
Traders are closely monitoring price action to see if XMR can sustain its upward momentum toward this target.
Strategic Approaches: Riding the Bullish Wave
Entry Strategies:
Traders might consider entry positions based on the breakout, looking for confirmation of the bullish momentum.
Conservative traders could wait for a retest of the breakout level for a more secure entry.
Risk Management:
Setting stop-loss orders strategically is essential to manage risk, especially in volatile markets.
Regularly reassessing the trade in the context of evolving market conditions is a prudent approach.
Conclusion: MONERO's Bullish Symphony
With the Bullish Cup and Handle pattern taking center stage, Monero's chart exudes optimism and potential. As XMR eyes the $188 mark, traders are poised to capitalize on the anticipated bullish surge, making MONERO an asset to watch in the coming trading sessions.
🚀 Cup and Handle Power Unleashed | 📈 Targeting $188 | 🔄 Navigating the Bullish Momentum
❗See related ideas below❗
Share your thoughts on Monero's Cup and Handle pattern and join the conversation on how this development might shape the future of XMR. 💚🌐💚


XMR vs. ETH: Two Patterns Unfolding! 📈✨Today, let's embark on a fascinating journey comparing two heavyweights in the crypto realm—Monero (XMR) and Ethereum (ETH). These titans share a common thread with identical patterns on the weekly timeframe. However, the tale takes a compelling twist as Ethereum takes the lead, already executing a breakout, while Monero patiently accumulates within an ascending triangle. Let's delve into the details of these intriguing market narratives. 🔄💡
Unveiling the Parallel Patterns:
ETH's Commanding Breakout:
Ethereum's Leadership: ETH has already demonstrated its strength with a decisive breakout from its pattern.
Trailblazing Moves: Ethereum's proactive stance sets the tone for the broader market, showcasing early signs of bullish sentiment.
Monero's Patient Accumulation:
Ascension within Triangle: Monero, on the other hand, is quietly accumulating within an ascending triangle.
Building Pressure: This pattern often indicates a building of pressure, hinting at an impending breakthrough.
Analyzing Market Dynamics:
Ethereum's Momentum:
Pacing Ahead: Ethereum's breakout suggests a surge in investor confidence and potential sustained momentum.
Market Sentiment: Traders keen on Ethereum should stay attuned to the prevailing market sentiment for further cues.
Monero's Strategic Positioning:
Strategic Accumulation: Monero's patient accumulation implies a strategic positioning, aligning itself for a potential upward movement.
Watch for Breakout: Traders eyeing Monero should be on the lookout for a breakout, which could trigger significant price action.
Trading Considerations:
ETH as a Market Indicator:
Leading Indicator: Ethereum's movements often serve as a leading indicator for the broader market.
Reference Point: Traders across various assets can use Ethereum's performance as a reference for market sentiment.
Monero's Breakout Play:
Timing is Key: Timing the breakout for Monero is crucial, and traders should position themselves strategically.
Confirmation Signals: Look for confirmation signals, such as increased volume and sustained price movement.
Conclusion:
As Ethereum and Monero unfold their respective stories on the charts, traders and enthusiasts alike find themselves at a crossroads of opportunity. Ethereum's breakout sets a positive tone, while Monero's patient accumulation suggests a potential surge in the making. Navigate these narratives with diligence and strategy for a rewarding journey.
❗️Get my 3 crypto trading indicators for FREE!
Link below🔑

XMR long scalpScalp
Trade Type : Risky
Entry around 170-171
TP 180
Sl 169.5
Note: Not a Financial Advice.
Follow for more updates.

XMR/USDTMonero is printing a inverse head and shoulders pattern inside of a symmetrical triangle, the diagonal dotted line is acting as support right now, I have measured both targets for both patterns.
GL

monero waiting for break out.Monero try to break small channel down pattern.
If XMR success to break up, we will have a good bullish movement with target at fibonacci projection.
this target at $186.6 also same level as january resistance
don't forget to like this analysis,
If you have any question, do not hesitate to contact me
Your support at this analysis will also support Monero to reach bullish target
Click here to check my other analysis

XMRUSDT.1DBased on the provided market data for XMR (Monero), the current price stands at 169.4 USDT. The Relative Strength Index (RSI) for 4 hours, 1 day, and 7 days are 52.05, 63.38, and 62.35 respectively. These values indicate that the coin is neither overbought nor oversold.
The Moving Average Convergence Divergence (MACD) values for 4 hours, 1 day, and 7 days are 0.4, 3.4, and 2.3 respectively. The MACD is a trend-following momentum indicator that shows the relationship between two moving averages of a security's price. The current MACD suggests a bullish trend in the short term.
The Bollinger Bands (Bb) for 4 hours, 1 day, and 7 days are 172.4, 176.9, and 177.4 respectively. Bollinger Bands are a type of statistical chart characterizing the prices and volatility over time and these values suggest that the price is relatively stable, with slight volatility.
The support levels for 4 hours are 167.5, 162.8, and 159.0; for 1 day are 166.0, 158.0, and 146.9; and for 7 days are 156.7, 136.0, and 131.0. Support levels are the levels at which the price rarely falls below.
The resistance levels for 4 hours are 173.0, 182.0, and 187.0; for 1 day are 176.0, 187.0, and 209.0; and for 7 days are 188.0, 211.0, and 240.0. Resistance levels are the levels the price rarely surpasses.
In summary, based on the technical indicators, XMR seems to be in a bullish trend in the short term as indicated by the MACD. However, the RSI values show that the coin is not in the overbought or oversold territory, suggesting a balanced demand-supply scenario. The Bollinger Bands indicate that the price is relatively stable with slight volatility. The support and resistance levels provide potential points of reversal for consideration.
Please remember, this analysis is based on historical data and does not guarantee future performance. Always conduct your own research and consider your financial situation before investing in cryptocurrency.


XMR/USDTOMXSTO:XMR if you are looking for a 68% gain, well here it is and right now is a great entry sitting on support, you can front run this trade and enter now, or you can set alert on the white dashed line and trade the breakout, obviously if you enter now you will make more gains anon

XMR elliot wave analysisHi
here is the complete wave analysis of XMRUSDT which is filling the wave X

XMR/USDTOMXSTO:XMR nice R:R here clean retest and formed a nice descending channel which is a sign for a reversal, you can enter a long here and put SL below white line
FL

Monero (XMR) Is It Strong Enough To Stand The Bears?
Compared to other altcoins, the growth of XMR has been quite modest. Since the beginning of September, the asset's price has increased by 29%, while many coins have doubled or even tripled in value.
Currently, Monero is trading between a support level of $163 and a resistance zone of $171-$175. Given the correlation between XMR and BTC, if the overall positive trend in the market continues, it could lead to further growth in the Monero price. In that case, the next targets for buyers would be the levels of $180 and $187.
A correction of the uptrend is an acceptable development scenario. Below the current level, buyer orders are found in the range of $154.0-$158.5 and at the mark of $147. An aggressive fall in BTC could have a significant negative impact on the XMR price, as the support levels mentioned are likely not strong enough to hold back the heavy selling pressure.

XMRUSDT DIn daily time frame we can see a break and now on pullback we can open long position until 209$ and sl as you can see in my chart

XMRUSDT.P-IN BEARISH TRENDXMRUSDT.P is in a sideways market but I expect it to break the support and retest the support which is a confirmation of a bearish trend and we will ride it till the lower support level which is a 1:2 target, what do u guys think? let me know.

XMR - A Range But Strong 💪Hello TradingView Family / Fellow Traders. This is Richard, also known as theSignalyst.
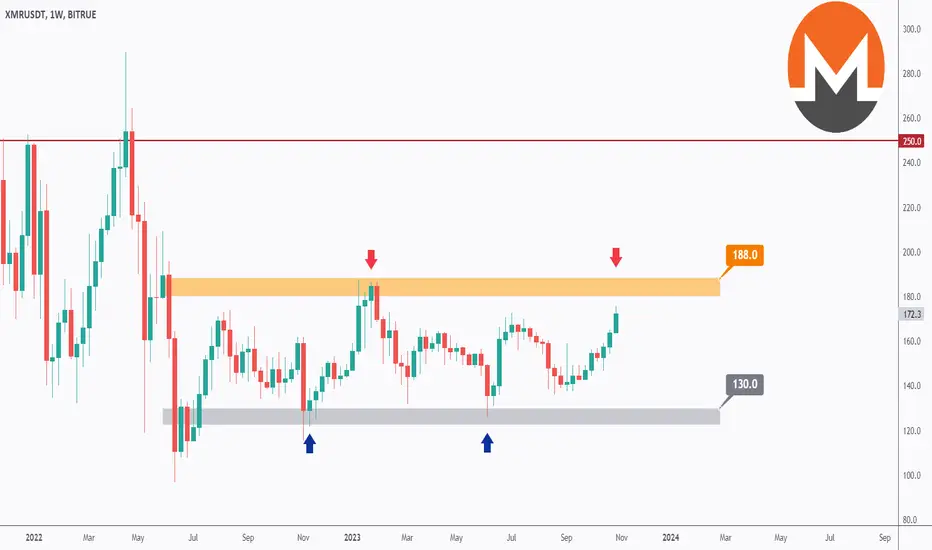
📊 XMR has been stuck inside a wide range between 130.0 and 188.0.
Currently, #XMR is hovering around the upper bound of the range.
📉 For the bulls to remain in control and take over from a long-term perspective, we need a break above the 188.0 resistance. In this case, we can expect further bullish movement toward the next resistance at 250.0.
📈 Meanwhile, the bears can still take control and reject the resistance. Confirmation will come if a bearish reversal setup is activated on the H4 chart.
Which scenario do you think is more likely to happen and why?
📚 Always follow your #trading plan regarding entry, #risk management, and trade #management.
Good luck!
All #Strategies Are Good; If Managed Properly!
~Rich
XMR CHARTING FOR MatosPoljca Here is my XMR chart on the weekly, The chart should be self explanatory

XMRUSDT Awaits Explosive Growth⚪ XMR has been locked in a year-long triangle pattern, where it straddles the line between bullish enthusiasm and caution. The crucial takeaway here is the unwavering commitment to the long-term demand, as evidenced by its faithful respect for the uptrend trendline. This, my fellow traders, is a strong indicator of the resilience and potential staying power of Monero. 📊
⚪ However, the crypto remains tethered under the grasp of the downtrend trendline, an aspect that often makes investors hesitate. But let's not overlook a significant development – the recent and clean bounce off the 78.6% Fibonacci retracement level. This isn't just a bounce; it's a sturdy support, working in harmony with the uptrend trendline.
⚪ The magic number to remember is $134 – a key support zone that, when respected, solidifies our confidence in the continuation of an uptrend. It's important to comprehend our trading strategy. We've decided to seize the moment and take a long position in XMR without waiting for the elusive breakout of the downtrend trendline. Why, you ask? Well, we've already identified a compelling risk-reward setup.
⚪ Moreover, we're keeping a close watch on the downtrend trendline. It may very well crumble under the pressure of intensified buying, presenting a slightly tardy but still promising entry point for long-term buyers. The nitty-gritty, including our trade signal with stop loss and take profit levels, is conveniently available in our channel.

XMR can go upBy examining the chart, it seems that we have a symmetrical one, and its final branch, i.e., looks like a triangle.
It can go up by keeping the green area. The red box can be the target of this upward movement
This is an update to the analysis linked in the relevant section
For risk management, please don't forget stop loss and capital management
Comment if you have any questions
Thank You

XMR is near the razor's edge!From where I entered "START" on the chart, the XMR symbol has entered the corrective phase.
The structure of this corrective phase is twofold. We've had a diametric followed by a wavy X and then another diametric again. We are now at the end of the second diametrical F wave. Wave G can end somewhere between the drawn fibos corresponding to the relativity of wave A to wave G of the second diametric.
For risk management, please don't forget stop loss and capital management
Comment if you have any questions
Thank You
