Palladium is crazy!!!Palladium gained 40 percent this week! A high amount of Palladium comes from russia, that means the amount that can be sold is falling dramatically, good for the price!
Palladium formed a crazy parabolic curve and even broke above main resistance! Palladium needs a healthy correcture! I think a retest of 3k will happen in the next few days, the volatility is very high, but falling in the short term. Also 3.4k is a very strong resistance!
buy: around 3k
take profit 3.4k
stopp loss 2.950k
A always this is no financial advise! Do your own research!
Have a nice and profitable Monday!
XPDUSD trade ideas

Palladium - Short!Alternate View to the Previous Chart -->
Palladium - Weekly Chart - Correction wave C is expected to drag the price up to the $1370.00 range. TVC:PALLADIUM CURRENCYCOM:PALLADIUM CAPITALCOM:PALLADIUM OANDA:XPDUSD NYMEX:PA1! FX_IDC:XPDUSD PEPPERSTONE:XPDUSD EASYMARKETS:XPDUSD FX_IDC:XPDUSDG
given chart invalid if price exceeds 2698.61 in the short term.
Educational Purpose Only! Do Analys before taking a position!!!

PALLADIUM MNT: 300% GAINS TP 10 000 USD (NEW)(SL/TP)Why get subbed to me on Tradingview?
-TOP author on TradingView
-2000+ ideas published
-15+ years experience in markets
-Professional chart break downs
-Supply/Demand Zones
-TD9 counts / combo review
-Key S/R levels
-No junk on my charts
-Frequent updates
-Covering FX/crypto/US stocks
-before/after analysis
-24/7 uptime so constant updates
🎁Please hit the like button and
🎁Leave a comment to support our team!
PALLADIUM MNT: 300% GAINS TP 10 000 USD (NEW)(SL/TP)
IMPORTANT NOTE: speculative setup. do your own
due dill. use STOP LOSS. don't overleverage.
🔸 Summary and potential trade setup
::: PALLADIUM MNT chart review
::: chart is LOG SCALE
::: commodity super cycle in progress
::: 5 waves bullish sequence in progress
::: Price target in 2022 is 8 000 - 10 000 USD
::: global inflation driving prices
::: supply shortages / critical levels
::: supply chain disruptions driving prices
::: geopolitics triggering vertical market
::: recommend to BUY/HOLD BUY DIPS
::: 12/24 months as global economy
::: this is a long-term bullish market
::: BULLISH CYCLE is ON BUY DIPS
::: BUY/HOLD get paid / swing trade setup
::: BUY ANY DIPS / final TP BULLS is 10000 USD
::: 300% upside from current market price
::: WAIT for dips and reload (BULLS)
::: recommend to BUY/HOLD
::: recommended strategy: BUY/HOLD
::: bullish super cycle in coffee market
::: SWING trade setup do not expect
::: fast/miracle overnights gains here
::: good luck traders
🔸 Supply/Demand Zones
::: 2500USD fresh demand zone
::: 10000USD fresh supply zone
🔸 Other noteworthy technicals/fundies
::: TD9 /Combo update: N/A
::: Sentiment short-term: BULLS / MORE GAINS
::: Sentiment outlook mid-term: BULLS / SUPER CYCLE
RISK DISCLAIMER:
Trading Crypto, Futures , Forex, CFDs and Stocks involves a risk of loss.
Please consider carefully if such trading is appropriate for you.
Past performance is not indicative of future results.
Always limit your leverage and use tight stop loss.

Palladium Looks Promising for further upside
Hello everyone:
Commodes such as XPD has been pushing up steadily in the last few months, and further upside is very possible.
Here we can see the higher time frame of Palladium. After price made a sharp impulse move, it falls into a larger structure.
With a swing highs and lows, double tops, and reversal bullish price action in the lower time frames to impulse up.
Now price is forming another continuation, watch for this completion as a confirmation for more upside move to the top.
Thank you

2 parts to your wealth prosperityThanksgiving and Christmas are round the corner and Covid-19 or not, people will be busy shopping for presents for their loved ones. This is also the time where some people begin to feel more generous than before and donate or give to the less privileged.
What's often misunderstood in the Prosperity equation is we must be generous in giving back to society. I agree with that but that is only half the equation.
The other half is the Law of Receiving. Too many of us are not quite open to this concept. If you are quite well to do, you would think to receive more is sinful as there are many who are suffering and thus you are rejecting what the Universe is offering. As such, you stay stagnant, neither poor nor wealthy. And that also means your giving is limited to what you have.
When you are receiving, it means that you are willing to accept it from the Universe. You are happy to accept gracefully and openly what comes to you. This can be receiving an idea, money from other sources, a promotion, career change, a new relationship, etc.
Have you heard of stories about colleagues whom you think are well qualified for the promotion but they rejected the offer ? Deep down, their subconscious mind is filled with fear and they do not believe they deserve the promotion. As such, opportunities can come knocking on your door but still it will not be received.
Our mind is the floodgate to receiving the gifts from God/universe and we must be careful what goes in and out of it . Read Proverbs 4.13
So look at how you spend your time will in some way tells you how well you are on the journey of prosperity. Are you spending time in office making idle talks, gossiping and finding ways to skip your responsibilities ? Are you the kind that gets excited when time to knock off comes ? Do you spend endless hours watching TVs than to use it wisely for self-improvement ?
Do you take time to look after your own health by doing exercises and watching what you eat ?
Trading and investment works the same way in the law of receiving as well. When you are open to it, in your mind, you would imagine a scene that you have earned the profits and feeling how relieved and happy you are. And what do you do with it ? You could share the ideas with more people, helping them to prosper as well. Or you took partial profits and buy something for your loved ones. You do not look at spending the profit money means you have lesser with you because you know and believe you would receive more , accept more from God/universe.
Look around yourself - are their friends whom you know are constantly giving to charities, religious organisation but their standard of living seems to stay the same ? And you could tell they wanted more , they prayed and prayed but somehow their prayers are not answered.
See it this way - they prayed for it and when God open their doors with opportunities (sometimes disguised as challenges), they dare not receive it, in fact they opposed it as they have fear and worries and limiting beliefs. They are afraid to upgrade , to be better off (when the world is undergoing recession), in short they do not think they deserve it.
How about you ? Do you deserve to make the profits you want in your trades/investment ? Why do others make 1000% or more during this Covid-19 period while others are still procrastinating if the market is going to crash ? Maybe they are lucky. And if luck means preparation meets opportunity , I would say they are mentally prepared to receive the gifts from God.
Open your mind, believe that God wants all his children to prosper , there are abundant money and resources to be shared amongst all of us. No need to worry if you make the 1000 profit and someone will lose on the other side. He will receive in kind or more in other ways blessed by God. At the same time, when you are prospering, do remember to give back. That way, the cycle is complete.

PALLADIUM THE WHITE KINGAMEX:SPPP 80% of Palladium comes from two main countries like South Africa and Russia. Since Dec 16th, 2021 Palladium has grown 68% in 72 days, less than 3 months. Palladium prices will potentially increase due to the supply pressures of palladium not moving from Russia due to the tougher sanctions stemming from the Ukrainian invasion. Roughly 50% of the worlds Palladium is produced in Russia. Banks, businesses and other countries will not be able to buy or do business with Russia, therefor causing palladium to potentially surge and breakout in my opinion due to the high demand of 8 million ounces the world needs every year.
Palladium is currently at $2,364 per ounce--In any given general year approximately 10 million ounces of supply are provided a year for palladium. 7 million come from mines from two main countries like South Africa and Russia. The other 3 million come from recyclable palladium.
"In 2000, both Russian and South Africa failed in suppling palladium which resulted in palladium increasing from around $200/oz to over $1,000/oz within a few
months." So I can imagine based on the current economic situation how Palladium will perform in the future considering higher and multiple interest rate hikes, covid, inflation over 7%, War in Ukraine and World Wide market corrections, crashes and meltdowns as just a few examples of the abundant variables that could make palladium the contrarian investment to watch for 2022.
2020 was just the beginning in my opinion for palladium prices to start breaking out. In 2020 alone, platinum prices have climbed more than 90% (for the period 3/20/2020 to 3/26/2021) according to Sprott special reports and charts which I have personally observed.
I have taken a position in the closed ended ETF by Sprott ticker symbol SPPP and will be increasing my position as I see fit as a long term investment and not as a trading asset.
Thank You,
CryptobuzzAnalyst-Contrarian Investor and Trader
PS. This information should not be construed as trading or investment advice. This is only for entertainment and educational purposes. You should perform your own diligent research and be responsible for your own actions.

Palladium: 1D Chart ReviewHello friends, today you can review the technical analysis idea on a 1D linear scale chart for Palladium.
The chart is self-explanatory. Palladium Price has been moving up a Rising Channel recently but the overall trend looks like a Bearish Divergence. Since the RSI was recently supported by a support line, the price has the chance to keep moving higher, however if the price breaks down from the Rising channel, it may come down to the 0.618 Fibonacci Retracement level where the measured move is as well as that area being a strong Support and Resistance zone. If price moves up from the rising channel, expect it to be met with resistance at the multi-year resistance line.
If you enjoy my ideas, feel free to like it and drop in a comment. I love reading your comments below.
Disclosure: This is just my opinion and not any type of financial advice. I enjoy charting and discussing technical analysis. Don't trade based on my advice. Do your own research! #cryptopickk

Palladium - Incoming Wave 2 Correction - Short!Palladium completed its wave 1... Short-term Correction wave 2 is expected to drag the price up to the 1965.00 range.
given chart invalid if price exceeds 2698.61 in the short term. TVC:PALLADIUM CURRENCYCOM:PALLADIUM CAPITALCOM:PALLADIUM OANDA:XPDUSD NYMEX:PA1!
Educational Purpose Only! Do Analys before taking a position!!!


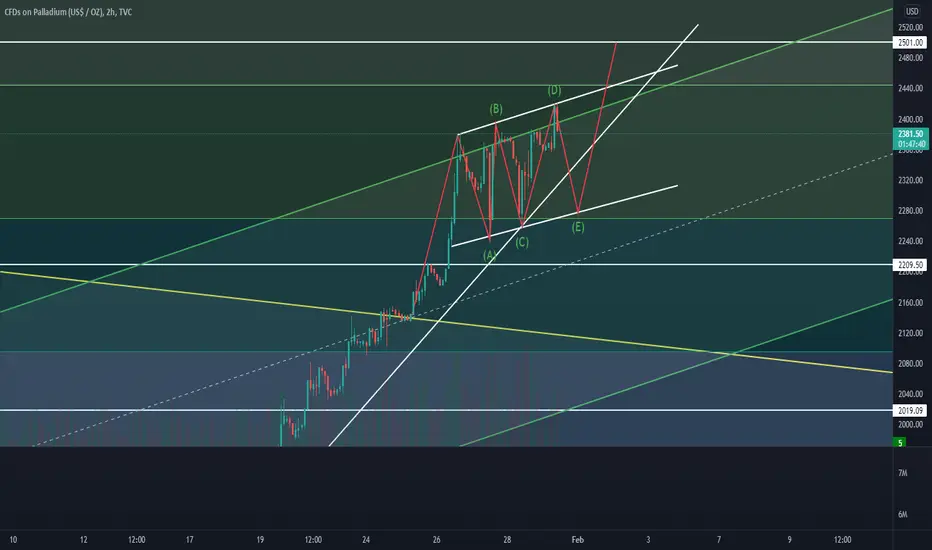
Possible BULLISH triangle on 2hrWe are completing the final wave of the bullish triangle. Long if no breakout below the neckline. Goodluck.
PALLADIUM to down 86%Have you noticed something? 1980 | 2001 years were the declining years for it. And the bearish period longed about 2 years with a 86% decline from it's ATH. As you noticed the bearish period comes in every 21 years! This year is: 2022 and tend to be the next 2 bearish years for Palladium with a target $400-$500 (86% decline from ATH, the last ATH was at 3000 price).
Good luck in trades, buddy.

PALLADIUM - Short PositionPalladium slipped 4.6% to $2,252.68 per ounce, after fears of supply disruption due to the Russia-Ukraine conflict drove it to a two-week high on Monday.

Bullish on PalladiumWhy am I long on Palladium?
- The majority of palladium supply comes from Russia and Ukraine, and with current economic conditions, a supply shortage (aka price increase) is likely.
-Inflation is out of control in. When almost every other country's currency bleeds against the US dollar, this is not a good sign. Precious metals to the moon!
- A bounce off the long term upward trend line is pretty bullish and shows that although the current price seems high, there could be a lot more upside ahead.

Palladium - a small short before the move higherPalladium has just provided three reasons why I will look for a retracement before looking for the long.
1. Market has reached a trend line connecting tops - 9 month span
2. Market has hit the 1.272 from high 18th Nov (double top) - low 31th Dec - the 1.272 is the pink line. Note: We need to take in to account the larger swing from Dec15 - present.
3. Market has hit the 618 of the last big swing from high May 21 - 31 Jan - the black line is the 618
From here we look for a pullback to the 382 that happens to be a strong support zone - light blue line
After the pull back we go LONG with an ABCD pattern and the top of our range box to reach our target.

Palladium - Still not too late exit Buy- Reversal in progress Palladium - Still not too late exit Buy- Reversal in progress. Keep tune up for the next update.. watch out for the reversal.

Can we reach 2505?!We've seen some impressive rally in January and we can still sense the presence of the bulls therefore today we gonna aim for 2505 as take profit target.

Short Nice short opportunity on palladium . It is important you scale your position relative to account size . I recommend loading up as trend takes shape .

PALLADIUM SHORT ANALYSISHi there,
As you can see, there's a DIVERGENCE happening on the RSI and MACD. As price action is going up, the RSI and MACD are reversing. So We should expect to see a FALL at least 50%.

PALLADIUM DAILY BUY SET UPHi TRADERS this is my trade set up for PALLADIUM for the new week ahead
PALLADIUM I am expecting a break above the 22066.50 level , so I am only looking for a buy trade after this break out
This is my analysis only please trade with caution and risk management in place
clean crisp charts I hope it helps if you have any questions please private message me
good luck for this weeks trading
please like comment and follow

XPDUSD Friday 21st Jan '22This is my play for the day., Palladium short term moving region for Friday 21st Jan '22


PALLADIUM (XPDUSD) Breakout !!PALLADIUM (XPDUSD) has given a breakout from falling trendline and is sustaining above it.
We are expecting bulls to continue their attack and break all minor resistance. A buy on dip stance should be adopted with calculated risk one can ride the uptrend.
Trade your levels accordingly.

XPDUSD Tuesday 18th Jan '22Due to the MLK holiday in US, yesterday we didn't saw much of a movement in the Palladium chart therefore we are about to stick with the same idea from 17th, a short movement up in attempt for a support growth around 1920 (sell) followed by immediate turndown looking towards 1821 (take profit)
