PALLADIUM 4H - Long ideaExcalibur has given us a couple of long indications on this over the last 2 weeks. Lets see if it goes to its target level indicated.
KOG
XPDUSD trade ideas

PALLADIUM Trade based on the 4H MA200 and the 1D MA200Pattern: Channel Up on 1D.
Signal: As long as the 4H MA200 (yellow trend-line) supports, buy the dips. If it breaks potential prolonged sideways action until the 1D MA200 (orange trend-line) approaches.
Target: Trade within the patterns that will be formed.
** Please support this idea with your likes and comments, it is the best way to keep it relevant and support me. **
--------------------------------------------------------------------------------------------------------
!! Donations via TradingView coins also help me a great deal at posting more free trading content and signals here !!
🎉 👍 Shout-out to TradingShot's 💰 top TradingView Coin donor 💰 this week ==> xBTala
--------------------------------------------------------------------------------------------------------

PALLADIUM PRIMARY ANALYSISJust to represent graphically, we have the square of sides 441.71 X 441.71 on both sides
The 0.618 Fib division of the square was the level price reached in February 2020, the top of the crash,
The crash settled on the 0.382 division of the square for the next advance
The bottom of the crash was 883 weeks from the origin of the cycle in 2003
So time axis reached 2.0 of 441.71 exactly at the bottom of the crash and price axis reached only 0.618 level
441.71 * 0.618 = 273 units ( Price axis )
441.71 * 2.0 = 883.42 units ( Time axis )
So we expect that between the 2.0 time and 2.618 time axis the top could be reached. Prior to the 2.618 time we
have the 2.236 or root 5 time axis to monitor against price.
Good luck and take care guys

XPDUSD, Long as we at support levelHighs on the support area has been broken and retested therefore we take this as confirmation to Long. Also expect head and shoulders or double bottom. But if price breaks 2908.849 this will invalidate the buy. Good Luck.

Palladium Setting Up To Go LongPalladium had a nice run between 2018 and 2020 with a rise of 245% during this period
before the Covid-19 pandemic hit price.
From that point, price created an all-time high at the time of £2875, then there was
a sharp decline to near the $1500 round number.
The round number and the 50 simple moving average cushioned the fall and gave price
enough support to find its footing.
Price has slowly been climbing back up, using the 50 simple moving average as support
along the way, and went on to create new all-time highs last month at $3017.
The previous all-time high is below price and has acted as support already and may be
the base price needs to help it to continue creating record highs.
If price can break and close above the recent high, this would also take price above
the $3000 round number and allow us to look for a position in this commodity.
See below for more information on our trading techniques.
As always, keep it simple, keep it Sublime.

Trading idea #Palladium #XPDUSD $XPDUSD longStop buy 2585 $
Stop loss 2383 $
Take proit (33% of the position) @ 2875 $

PalladiumIt didnt buy as i expected it to but on the other hand
It made a suppurt for a huge market sell of if it breaks


Short Palladium @ 2,882; TP @ 2,550 & SL your choiceShort Palladium @ 2,882; TP @ 2,550 & SL your choice


Palladium 23 Points To Breakout!Palladium should not be ignored even if there are strong moves happening in other markets because this
commodity has the potential to trend well long-term.
The trend between January 2016 and February 2020 saw a 542% move to the upside allowing for the
accumulation of simple profits during that period.
As expected, price went into consolidation following such a strong move but within this consolidation
period, price has slowly been climbing its way back up.
On the weekly chart shown, we can clearly see that price has been using the 50 simple moving average
as support to assist it in climbing higher.
This week price came close to breaking out above the all-time high at $2875 by just 23 points, so there
is good progress since our last post.
If price eventually breaks out, we anticipate a strong trend in the direction of the breakout. We will
also need to wait for a break and close above the $3000 round number which is a psychological level of
support/resistance. Patience for now as we await that breakout.
See below for more information on our trading techniques.
As always, keep it simple, keep it Sublime.

Palladium testing ATHPalladium had a great run the past month after about a year of consolidation. There is currently very strong upward momentum testing resistance at ATH. As you can see, the price is also on a rising wedge and hence a correction is imminent. I expect Palladium to retest 2850-2870 at least once more before moving lower to its new support at the 2680-2700 level.
Note: I'm currently long Palladium with average buy price of 2660. My trail stop is currently set at 2772.

PalladiumI'm currently expecting a move to the downside to complete the full corrective pattern. We could still be in a sideways move going up before we get the sell.
After targets are hit, I'm expecting the start of a major uptrend.


XPDUSD WAVE 5In case you missed the first entry, second opportunity on XPD, first target at 2882. big possibility for overperformance
See link in related ideas

XPDUSD WAVE 5XPDUSD Broke out of a channel that was the for a loing term, retested the level and looks like it will continue trending upwards to make the 5th wave
Share thoughts in comments
Like the work and follow for more trade ideas and education

Eco/monetary news n°28> Idiocracy: For the first time in history some sad fools buy farts and other silly garbage
***********************
It was said by merchants for thousands of years every now and then that the best one, or the ultimate test of skill would be the ability to sell wind to suckers.
Looks like it is happening now, but not because of some super convincing sellers, people just keep getting dumber and this is the golden age of tech scams "you just don't get it man", and "if scam then why price went up?", also "they said the same thing about (some invention) amazing arguments.
Let me introduce: NFTs. It's some stupid pointless blockchain tech based scam, and people truly are buying farts, as well as tweets, "rare pepes" which are random paint drawings made by random people.
I sure hope this ridiculous worse than beanie babies scam does not get traction, or do I?
Sure would be fun to laugh at the suckers that blow their life savings to buy thin air.
> Over 60% of all financial fraud scams come from crypto in Austria, regulator report says
***********************
"So what if crypto is used by criminals fiat is too", another genius argument, and as usual they forget Bitcoin and other magic beans are fiat, or do they actually think they have intrinsic value? Where does it come from? Magical fairy dust?
Crypto is used for what? 0.001% of legit transactions? And possibly a good 50% of all gambling.
So now a few months after the UK FCA banned cryptos, austria Financial Market Authority reported that 2/3 of financial fraud was crypto related, what? You're telling me crypto gamblers are more gullible (or plain dumber) than other people? No way! If you think this you just are a dinosaur that doesn't understand the tech.
The regulator also said that the cryptos - that seem to have been designed specifically for crime - are making it more laborious to trace scams because they easily move around the planet. Which is why they say they see a need for much stricter regulations.
> John "they'll never find me" McAfee arrested and charged with pumping crypto schemes
***********************
Haha! Remember the videos of this idiot circulating sniffing coke and saying "if Bitcoin no 2 million math itself is flawed".
How could anyone listen to this creep? His brain cells got burned by all the drugs. His trustworthiness is equal to BTC fundamental value.
He was arrested in Spain and the US are trying to get him because he promoted some crypto schemes without mentioning he was getting paid to do so.
I don't get it, why do the US want to prosecute him? It makes no sense. When it's that obvious it still counts? Why?
What kind of idiot thought he was legit interested in all these coins? Who cares about them?
If we lower the bar for the dumbest of the dumb then life is not even possible, have to spell out the obvious all the time or get sued.
And it's hard, pretending to be dumb, can't always guess what dum dums need to be explained very slowly... "2+2 is 4 remember?"
When someone sells diving equipment he does not remind everyone to "make sure you breathe through the tube when underwater you can't breathe water".
A while ago some brainlets drank cleaning liquid and died, so a judge ordered the society that makes those bottle to indicate "it's not a drink" and put scary pictures on or something, to prevent natural selection from happening.
This constant lowering of the bar is unsustainable...
Usually crooks (P&D promoters, daytrading course sellers, etc) get away with a slap on the wrist, but this guy has many other crimes.
> Goldman Sachs employees describe their inhumane working conditions at the greedy bank
***********************
I think we found why investment bank traders sucked so much, in a survey a couple of juniors described their low skill wageslave lives, they have weeks of 95 hours (13.5 hours a day), said they slept about 5 hours a night, that when they started they had a solid mental health at 9/10 and it dropped to a 2, etc.
"My body physically hurts all the time and mentally I'm in a really dark place".
14+5 = 19. What are they doing the other 5 hours?
The CEO said that the period was very active because clients were very active, he's trying to say it's not always like this...
"What is not ok to me is 110-120 hours over the course of a week! The math is simple, that leaves 4 hours a day for eating, sleeping, showering, bathroom and general transition time," one analyst said. 120/6. So they have 1 free day? What's the point?
Laws? Would be much better to sleep and spread it over 7 days. 14 hours over 7 days is 100/week. I estimated I did this for 18 months when I wanted to acquire stats & knowledge, easy.
It's like tryharding & binging on a video game, no one says gamers are overworked. Wagecucking is different, even 1 hour a week of it is too much and unbearable. Yuck.
Lmao these guys whine that they don't have time for friends and going out, that's what got to them? Not the lack of sleep?
"Going out" is for losers. Women do pointless social stuff. Us men hunt (about 99% of traders & GS juniors right?).
Got no time for this depressing standing around in limbo waiting for time to pass. Winners don't waste time with useless activities.
> Palladium explodes out of range after 1 year bear market, now worth 50% more than gold
***********************
The bull market is back? This rocket ship gets no attention, but doesn't Elon use it?
Maybe he'll tweet about it and the zombie hordes will all become experts on the metal they never heard of days before.
Supply is recovering, demand too, carmakers and other industrials are just going to keep bidding up prices, the US fedgovernment will print more money "so we get all we need" and bid up and then print more and then bid up and then print more.
"Weimar can't happen" because I'm sure germans were so expecting it.
These guys are so delusional, they're the dumbest humans in history and they're persuaded something "can't happen", it can happen now more than ever! How can they keep failing and never learn. Hyperinflation will come, and they will see it as normal "in the moment" with their goldfish memory and even argue that it's a good thing and perfectly normal. Then in hindsight they'll be experts.
> Michael Burry warns the world of Weimar 2.0, the SEC pays him a visit for "spreading panic"
***********************
Crazy hyperinflation in Germany took place over a period of 2 years (+3 years strong inflation) that's like an eternity for the public.
They won't even notice they will get used to it and see it as normal. They will wake up when they lose their job, the electricity goes out, and their stomachs are growling. Lmao the government and their minions will probably laugh at smart people pointing out the collapse and call them "conspiracy theorists". Never underestimate human stupidity, it's the only 1 thing that is infinite.
Michael Burry was blamed for "not warning of the housing bubble", actually he did, and the blamers, typical hindsight experts, expected to magically hear about it from before he got famous with their hindsight time machines I imagine.
So this time he made a public announcement on social networks. He left a trace. And then the SEC (LOL!) paid him a visit blaming him for "spreading panic", so he deleted the traces. LOL!
You can't change destiny. Ignorant people always say "if only we knew" and bla bla bla. Well you know now. And NOTHING will change.
As Peter Schiff asks, are they (the SEC, FED, and presidency + congress) aware of it all and trying to kick the can down the road, or actually dumb enough to believe their scam works and you know, really think this is all "fearmongering".
All I know is prices of the primary layer are way up and staying up, and prices of the second layer are starting to follow...

BULLISH MOMENTUMTHIS IS MY BULLISH TREND CONTINUE IDEA. HOWEVER WAIT FOR COME KEY LEVEL AFTER HOW TO RESPECT TO KEY LEVEL AFTER TREND CONTINUE TO UP TREND YOU CAN ENTRY ,SO THIS IS MY OPINION ONLY .

Palladium Slowly Waiting For A Break!Palladium failed to hit the $3000 mark during the bull run that ended in early 2020. Price created an
all-time high at $2875, which occurred just before the peak of the global pandemic and was followed
by a decline.
The 50 simple moving average on the weekly timeframe was there to cushion the sharp fall and has
been acting as a ladder ever since, slowly helping price to creep back towards the all-time high.
The previous trend ran from June 2016 to February 2020, going from $454 to $2875, which was a
rise of 540%. After such a big move in a long-term trend, it is no surprise that price is consolidating
as it has now run out of steam.
We can not sleep on Palladium because it has the potential to trend again once we have a breakout.
And usually, when price consolidates for a long period of time, we can expect to see a strong move
in the direction of the breakout. Hence, we need to ensure that we remain ready for any opportunity
that presents itself.
As for now, we need to wait patiently until that breakout occurs and avoid jumping in too hastily.
See below for more information on our trading techniques.
As always, keep it simple, keep it Sublime.


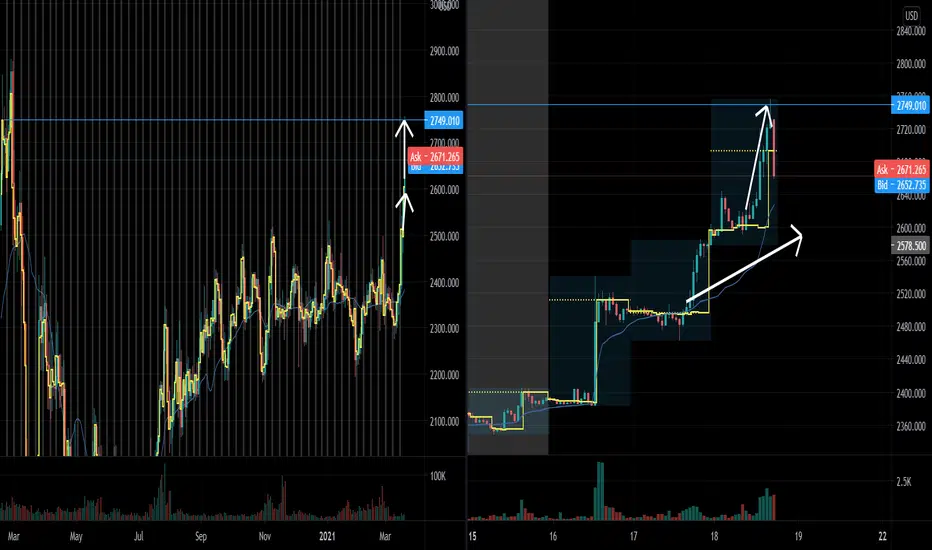
Palladium: Exited have of the position at 2749 (prior POC)Palladium is making new entry signals as there is a consolidation on the Developing POC and then another upmove
The Uptrend is now a bit extend so I take half of the postion of and trail the stop on the other half...