Entry points, supports and resistances.For the last published palladium idea: Entry points, resistances and supports.
If it breaks resistance upwards, using new support as entry for a sure entry.
It is possible to entry on the actual support (S1) and "hope" for a break upwards with a strict SL right bellow range. Risky. But for a scale in strategy, could work.
As there is a small RSI divergence (red dotted), support can break downwards to any fib support and ultimately to S2.
For future reference.
XPDUSD trade ideas

For future reference on FractalsPalladium.
Trend usages (today):
Catalysis
Electronics - The second greatest application of palladium in electronics
Technology - Hydrogen easily diffuses through heated palladium
Hydrogen storage - Palladium readily adsorbs hydrogen at room temperatures.
Looks like the usage will make it pricier. Palladium will continue the trend? Fractal to a long term investment considered. Consolidating the price ATM.

Palladium breaking out?On both price chart and SMA50% we can see a breakout from 12+ months resistance lines. Both were hit several times and did hold. Not this time. There was a breakout and the lines are being backtested now.
If breakout is succesfull we could see a swift up move with $3200 price target mid 2021.
I would put a SL just under 23 Feb wick witch is $2312.

XPDUSD 12 HWave 4 green finish
LD / leading diagonal / 1-5 white waves / finish / small time frame /

PALL s'moreMacro economic climate Suport the end of metals manipulation.
"loss of confidence in government produces monetary crisis Monetary Crisis, pushes metals higher."
M. Armstrong.
Political self destruction and ruin of the republic causes loss of confidence in government.
this is simple platinum.
I have matured a little as a technician. this rule set combines Gann fan , Fibonacci levels ( zoom out on the 2 day chart ) and fitted Ellipses

Retest then Pump - Long IdeaHello friends, today I bring you the 4hr chart of Palladium which recently broke the downtrending line and reversed from the important support around $2200. Palladium is running now into resistance around $2365 while RSI turning oversold. I expect the price to pullback to retest the downtrending line which could be a nice opportunity to add long positions after formation of bullish candlestick. As long as the price stays above 2288 on closing basis, Palladium can go higher to the targets outlined in the chart in the next few days/week.
Please share your thoughts and ensure proper money management. Thank you for the support and good luck with your trades.

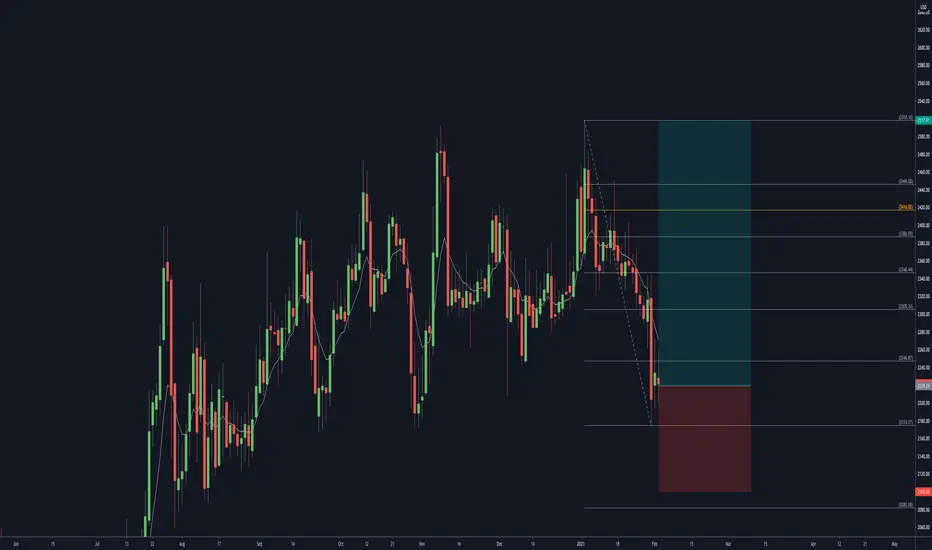

PALLADIUM 1D BEAR FLAGBear Flags are a Range type of chart pattern.
Bear Flag Ranges are repeatable trading chart patterns.
Bear Flag chart patterns will have a directional bias (Short) depending on the previous incoming trend.
Each chart pattern will have defining trendlines of the support/resistance levels creating the pattern.
What ever time frame you are trading this chart pattern, wait for a candle close outside of the trendline in the direction of the breakout candle. (Our time frame preference is the Daily chart).
Add volume indicator - Volume is the amount of $ that went into a particular candle or in Forex the # of trades that took place.
Add ATR indicator - Volatility is the amount of price movement that occurred. Use the ATR to measure the price movement.
When you see descending Volume bars and descending ATR line (which indicates volatility) this shows
a dis-interest in traders to invest in this pair creating consolidation which creates the chart pattern.
Trade Management after there is a breakout candle close.
1 - Position size (compare volume bar to volume ma line).
a - Breakout candle must be 100% of volume average for a full position size.
b - If 75% of volume average then ½ position size. (To find 75% of Volume
look at the charts volume settings – divide smaller # into larger # = 75%+)
If not 75% then stand aside from the trade.
2 – If candle breaks out of a trendline, 15m before the close of the day prepare your buy/sell order.
Enter two trades. 1st trade will have a SL & TP. It will close automatically when the 1st TP is hit. 2nd
trade only has a SL and will be allowed to run. When 1st TP is hit move the SL to breakeven. Look
at ATR and prepare SL at 1.5 of ATR. Prepare 1st trade TP at 1 of ATR.
3 - SL for both trades will be 1.5 x ATR.
4 - 1st trade TP will be 1 x ATR.
5 - No TP on 2nd trade – letting profit run and adjusting SL to follow price.
6 - When 1st TP hit – move 2nd trade SL to breakeven.
7 - Adjust the 2nd trade SL to follow price.
*8 – After Breakout candle – if price closes back into chart pattern close trade don't wait for SL to be hit.
*9 - When breakout candle is more than 1 ATR from breakout candle open.
a - Enter 1st trade at candle close with ½ position size.
b - Enter 2nd trade with a pending limit order that is 1 ATR of breakout candle open.
c – Price should pullback to that pending limit order for 2nd trade.
d – If Price returns back into chart pattern close trade before SL is hit.


Longterm commodityHigh inflation, widening deficit of palladium, money supply, recovering economy as well as car industry

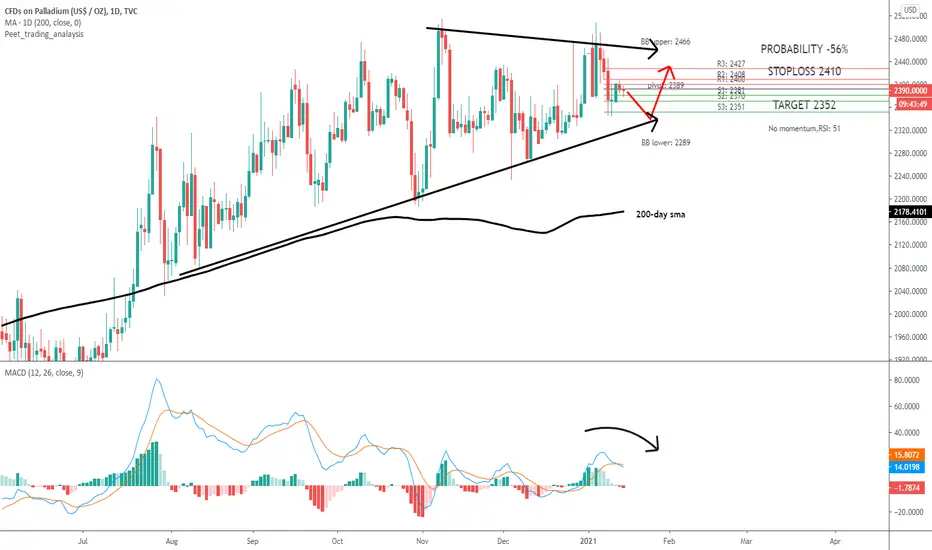
Palladium: Might we see some further downside?MACD crossing bearish.
Lack of downwards price momentum remains a concern.
Potential Palladium DropThis Idea is a bit conflicting and I am just trying myself out here
Going on Industrial want/need, Palladium should become more expensive in the near future and long term
But technically, it should be cheaper
Only time will tell

PALLADIUM Updated ThoughtsCurrently above major trendline
I assume this structure that is forming will break down into the wedge / triangle that has formed below, that will be the optimal entry point above the trendline of the spiral.
Bullish since the beginning.


palladiumpossible continuation diamond pattern playing out into wedge. palladium and platinum both are in extreme supply shortages. price will most likely be explosive.

XPDUSD price forecastWatch for breakdown on XPDUSD, completing wave C
Share thoughts in the comments
Like and follow for more content

PALLADIUM : 1st step done from previous chart now the retrace 1st step done from previous chart now the retrace 218x could be very good entry

$XPDUSD - Palladium trade setupHello everyone!
Two scenarios I'm tracking for Palladium.
The first is the confirmation of the Inverted head and shoulders and bullish from current level, the second is a confirmation of a bearish flag and a bounce back from the dynamic support.

Palladium - longer term bearishCalling tops in a massive uptrend has caught me out a number of times but I can't help looking at this chart and thinking that it needs another leg down to complete a correction. The massive leg down from the beginning of the year looks a clear 5 wave move to me (impulsive) while the move up from March looks corrective (to me at least). Lots of fib measurements all zeroing on at the 2600 level so lets wait and see......

Palladium USD profitable Strategy (Study)I'm showing you how my very profitable Palladium USD strategy worked out very well :)
Check out how this system nailed the perfect entry for XAU USD ( Gold ). Press play to check this Ground-breaking result!
*Richimoku ( Advanced Ichimoku Kinko Hyo with 4 Clouds! )
*Kumo Waves (Indentify divergences, trends, investor sentiment.
Know First. Act Faster. A must-have for every trader!)
*As some indicators you may come across are using the repainting mode (which consists in correcting the false signal back in time).
You'll never see such thing in the Richimoku Trading System. What's on the charts is displayed in real time, no cheating...
Send me a Message and Feel Free to test the Richimoku Trading System! I'll send you an invite. Study the chart history on all timeframes. Study all details incl. divergences etc. You'll love it :)
FAQ.
How to access the Richimoku Trading System in tradingview?
To access your indicator simply click on “Indicators” at the top of your Chart, and click on “Invite-Only Scripts”. Click on the indicator to activate it. That’s it!
Will the Richimoku Indicator Trading System work for Stock and Index trading?
Sure! It works on all Forex, Stocks, Indexes, Metals and Crypto's!
Does this indicator work with a free TradingView Account?
Yes you can use the Richimoku Indicator Trading System with a free TradingView account.

PALLADIUM BUYPALLADIUM
SELL
ENTRY 2315.00
TP 1: 2380.00
TP 2: 2440.00
TP 3: 2500.00
STOP LOSS 2240
Palladium requires a large Stop Loss

what do you think.if possible leave me a comment and explain the mistakes I made.
I have been in the field for a short time and I want to learn
