XPDUSD trade ideas


Mögliche Korrektur bei Palladium?!Nach dem starken Anstieg des Palladium Preises befindet sich der Markt nun auf dem daily Chart in der Überverkaufzone. Zudem sehen wir eine bearische Divergenz bei MACD und RSI. Wenn der Trendkanal welcher nun seit August anhält gebrochen wird sehe ich hier eine mögliche Korrektur auf ca. 1542 USD. Natürlich sollten wir hier noch auf Bestätigung warten.
Happy traiding!!!
- Wenn das Leben dir eine Kopfnuss gibt, dann sei ein Einhorn! -

XPDUSD (Palladium): Long term action plan. Buy opportunity.Palladium is now on a new Higher High within the 1W Channel Up (RSI = 68.210, MACD = 65.770, Highs/Lows = 97.7642). Based on the similarities with the 2017 Channel Up and with the 1D RSI having reached a peak level (RSI = 66.981) it is natural to assume that a minor pull back is in place (1,600 projection) that will only fuel the uptrend on the long term within the Channel Up. Based on that our Target Zone on a 1 year horizon is 2,200 - 2,400.
** If you like our free content follow our profile (www.tradingview.com) to get more daily ideas. **
Comments and likes are greatly appreciated.

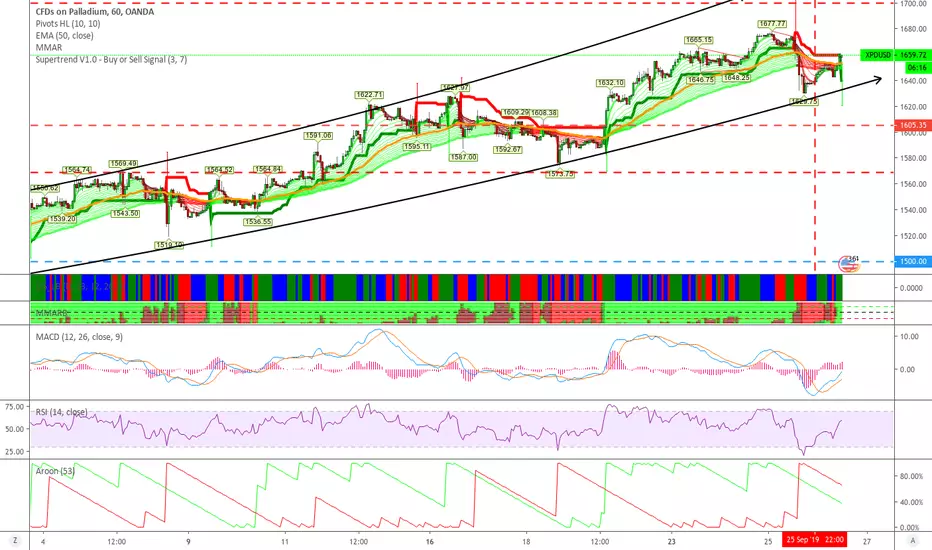
#palladium : target reach 1700 , what next now lol #palladium : target reach 1700 , what next now lol


Palladium Is Leaving Gold In Its DustOften when we talk about commodities, the popular ones that come to mind are Gold and Silver.
They have both performed well in the past. Gold is now looking interesting but has been stuck in consolidation since 2013
and silver is still range bound and requires multiple resistance levels ahead to be cleared before we will consider it.
What good is trading an instrument purely based on its popular name if there is little chance to profit from it?
Unhealthy attachments will kill your performance.
Good trading is about being detached from the name and instead being able to focus on the charts to
determine high-probability environments and setups.
A commodity which is rarely spoken about and performing exceptionally well is Palladium.
This metal is mostly used in catalytic converters for cars but can also be found in jewellery
and dental fillings amongst other uses.
With the way price is moving, you will also find Palladium on the watchlist of and in the trading accounts
of some smart traders and investors.
Why?
Because price is rising, it is that simple!
If we take a glance at the monthly timeframe we can see that price has been in a nice trend
since January 2016 from a low of $454.
Over the past few years, price has steadily been rising under the radar, moving up over
1,100 points which is an increase of over 250%.
On the weekly timeframe, we experienced a strong trend from August 2018 at $833 to March 2019 at $1,615.
This trend moved up by over 90% but came to a sudden halt in March 2019 where price pulled back
and then moved into consolidation.
The chart we can see is for the daily timeframe and we have highlighted the cup & handle chart pattern.
In an uptrend, a cup & handle is a strong trend continuation pattern of the bull trend. Now that price has
broken and closed above the high of this chart pattern, it confirms to us that the chart pattern has
completed which is the first indication that we are likely to see the next leg up.
Ideally, what we now need to happen is for price to pull back and retest the support, which was previous resistance.
If the support level holds, we then need to see the buyers push price back up and break above a previous high as illustrated.
This will confirm a continuation of the overall uptrend and we may see a strong trend to the upside.
By applying patience and waiting for a pullback, retest of resistance-turned-support, followed by
another breakout we drastically reduce the chances of getting caught in a potential head-fake
which can happen after a lengthy period of consolidation.
Applying patience is a key trait to a good trader as this will help us avoid an unnecessary loss
if a head-fake does materialise on this initial breakout from consolidation.
The daily 50sma is above the 200sma which indicates that we are indeed in an uptrend.
Both the 20sma and The 50sma are likely to be used as support if a trend emerges which will
help us with stop placement and exit management when our trading plan is met and we start placing long trades.


Palladium - 2 bullish counts Palladium seems to be showing a classic ABC zig zag correction with A and C waves that seem to be carving out 5 wave patterns. The issues in these counts to me is whether in fact my wave iii actually completed in March 2019 as the March high is also the 2.618 extension of it's wave 1 or in fact the current bullish price action is still in fact wave iii.

Short Palladium @ 1,673; TP @ 1,589, SL your choiceShort Palladium @ 1,673; TP @ 1,589, SL your choice

PalladiumTop is insight imo. Break above golden ratio, whenever it comes, will see price peak around 2200.
Btw I'm not trading this stuff.
/* DEFINITIVELY NOT TRADING ADVICE */

Palladium Investmentnext generation cars with hydrogen fuel cells use that resource, so an investment in that metal is advisable

XPD blow off topNew ATHs with XPD look like a "blow off top". Monthly bearish divergence. Short here and check back in 6 months time. GL


Good trendThis looks a little over extended but has had a nice bull run that maybe can still be of use.

Palladium set to fall Expecting price to retrace here to the 1x1, in this extended rise from palladium. Price has reacted from the 1656.50 level, which gives the short signal.


#palladium : rally continuepalladium rally should continue to new high next week, a bit dangerous to enter here


Palladium may have toppedFIb level + Elliot Wave + RSI divergence, Palladium may have topped, expecting a 2 week retracement
Gl u all
Not trading advice
