Palladium Double top?Wait for confirmation on break of 1500 level. IMO, palladium is going to be useless. It's #1 use case is in ICE cars, and IMO, EVS will be everywhere by 2030.
Trying to find a way to capitalize on the downfall. Not really any options out there, would love some input . Thanks!
XPDUSD trade ideas

Palladium - ShortCurrently trading at twice-ish of it's production cost. Bubble began due to demand outstripping supply but is being re-propped up by short covering. We're already starting to see it peal off the reestablished highs. As further production chases the 2x premium (cost of production $720 vs $1510.5 per Troy Ounce) and auto makers look for alternatives.
Risk: A deficit still very well exists and can be exacerbated by Russia sanctions on scrap exports.

Palladiuim short - Long termAs a shift in trend can be seen, a short entry could be placed around 1516 for a ride down to test marked levels.
Big level to be tested should be around 1140, hope we'll get there as a final TP.

Palladium Double Top SHORTI believe we reached a double top in the Palladium Chart. Also the fundamentals in the car industry and economy in general are getting worse which also supports the upcoming downtrend in palladium.
Looking Forward to hear some of your comments about my idea.

Palladium Showing WeaknessLast post: June 25th 2019. See chart .
Review: Price was moving towards resistance.
Update: Price has now started to pull back and is approaching the support level.
Conclusion: If price comes down to support and that level holds, then we may see another move to the upside.
Any comments or questions, do not hesitate to leave them below. Give us the thumbs up if you share our sentiments!
Sublime Trading


XPD USD SELL (PALLADIUM - US DOLLAR)Hi there. Price is moving impulsively as expected. Wait for the price to complete the continuation pattern that its forming and watch strong price action for sell.

Palladium sell signalsPalladium (PA), Weekly chart: Resistance zone + Pin bar/Shooting Star candle pattern + Extended divergence on RSI(14) + On Daily chart: Overbought + Divergence on RSI(14)

Palladium before 43% rise... Gold, bitcoin, palladium. What is common in them? The parabolic motion track. These three instruments were the first to pick up the parabolic track. A highly respected analyst, Captain Walker, pointed out earlier that some exchange rates are beginning to take up this type of movement. These movement paths are characterized by very high target prices, but also panic-like corrections resulting from increased volatility. Therefore, I can most likely say that there will be high rises in these three products, but also big falls.

XPDUSDSince August last year, Palladium had strong bullish momentum. It retraced to 31.8% Fibonacci on March and traded sideways after finding support on June. On Thursday it posted limited gains as investors widely took "a wait and see" approach. Upcoming summit off global leaders will decide investors on future moves. Based on current trade optimism, the truce between the two largest economies could underpin commodity to March peak around the 1600 level. Strong support is found on 38.2% Fibonacci near 1300 level.


XPD USD SELL (PALLADIUM - US DOLLAR)Hi there. Price is forming a reversal pattern to change its direction. Wait for the price to test the previous high and watch strong price action for sell.


XPD/USD Palladium 1578.418 VS 1311.485 Trade Setups Hello Traders, XPD/USD Palladium 1578.418 VS 1311.485
Blue: Developing a Bigger Corrective / Consolidation / Continuation Pattern
for further upside movement breaking all time high's 1578.418 / 1311.485 VS 1827.393 / 1705.807.
Yellow: Looking for smaller continuation / corrective pattern for current impulse to break 1578.418.
Red: Red: Consolidation / Correction / Continuation For more downside Breaking 1311.485 VS 1174.297 / 1057.763

Short Palladium @ 1,532; TP @ 1,400, SL your choiceShort Palladium @ 1,532; TP @ 1,400, SL your choice


Palladium Soaring Higher!Last post: June 17th 2019. See chart .
Review: Price broke through the first resistance level.
Update: Price is now approaching the next resistance level.
Conclusion: If price breaks through resistance then we should see a resumption of the bull trend and plenty of trading opportunities.
Any comments or questions, do not hesitate to leave them below. Give us the thumbs up if you share our sentiments!
Sublime Trading

XPD/USD Possible Downtrend Continuation Palladium started its Downtrend after reaching the top of its Uptrend on June 20 @ 05:00. Now we are at our second lowest High peak of the descending channel with signs of continuous falling.
Downtrend continuation will be confirmed when price falls below 1499.712 then solidifying the move once price falls below 1495.030. Both MACD and RSI show potential upside move, therefore
having our two price levels around busy consolidation areas will give both indicators time to reset for the new move.
-LNP Investments.

Short Palladium @ 1,500; TP @ 1,400, SL your choiceShort Palladium @ 1,500; TP @ 1,400, SL your choice

Palladium Fighting ResistanceLast post: June 12th 2019. See chart .
Review: Price bounced off support and found momentum to the upside.
Update: Price is currently at resistance but struggling to get through so far.
Conclusion: If price makes it through resistance then we should see further moves to the upside.
Any comments or questions, do not hesitate to leave them below. Give us the thumbs up if you share our sentiments!
Sublime Trading

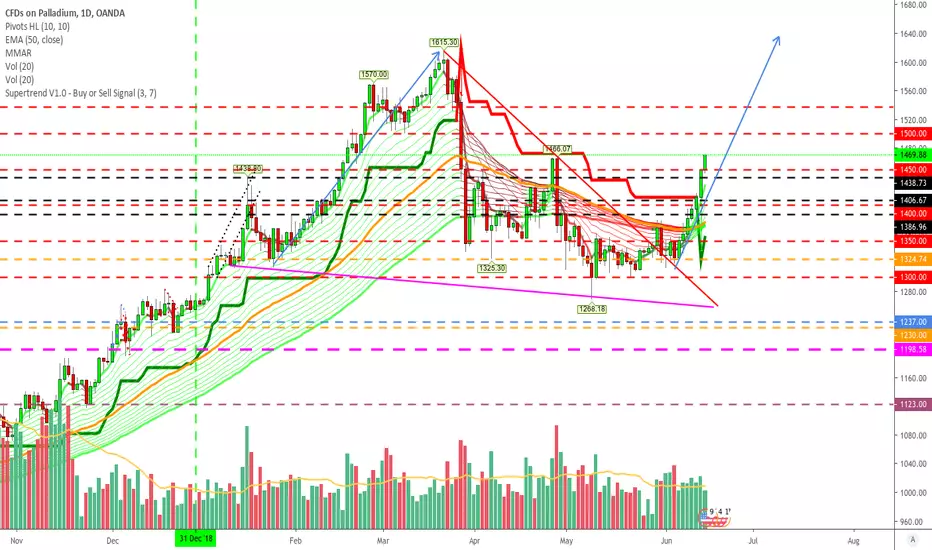
Possible end of ABC(DE) correction wave - very bullish pendant!After a long bull run, Palladium had a much needed correction. Upward price movement could resume soon to escape the bullish pendant or it could test 200MA (roughly 61.8 fib level) before leaving the pendant.
