Platinum Breakout Stalk: Thief Entry Only After Confirmed🧠 Thief's Heist Plan Activated!
Asset: XTI/USD (PLATINUM) 💎
Strategy: Bullish Pullback + Breakout Play 💥
🔍 We stalking platinum's neutral zone… waiting for that clean breakout!
No early entries, no premature SLs. Discipline = Profits. 🎯
🎯 Entry: After breakout confirmed. Use multiple DCA limit orders to layer in like a ghost.
🔐 Stop Loss: ONLY after breakout – Place at 1280.00 🛡️
💎 Target: 1560.00 – Vault unlock point! 💰
📵 DO NOT place SL or orders before breakout – patience is the thief’s edge. 🧘♂️
This isn’t gambling... this is precision trading. Breakout = green light 🚦
Get ready to raid the platinum vault!
#ThiefTrader #BreakoutStrategy #PlatinumHeist #XTIUSD #BullishSetup #SmartMoneyMoves
XPTUSD trade ideas
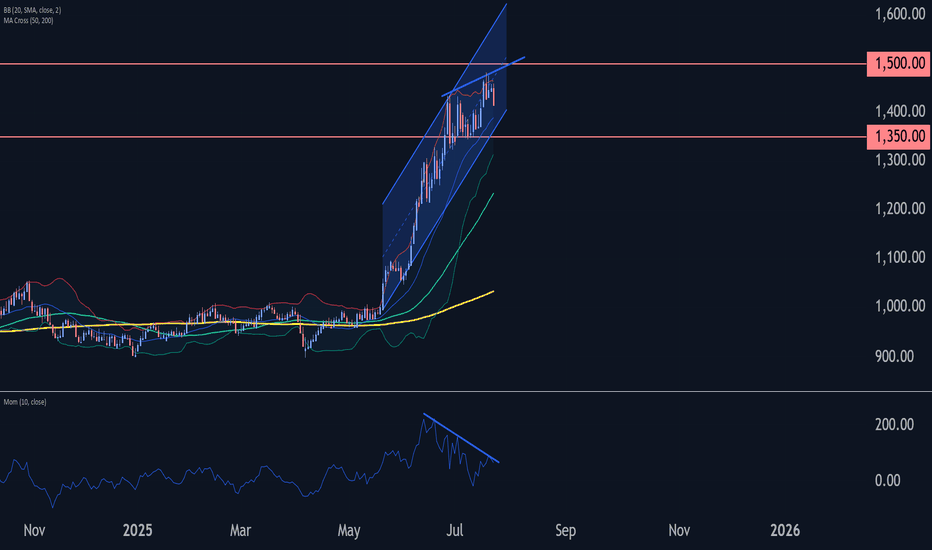
Platinum Wave Analysis – 23 July 2025- Platinum reversed from resistance zone
- Likely to fall to support level 1350.00
Platinum recently reversed down from the resistance zone located between the round resistance level 1500.00, upper daily Bollinger Band and the resistance trendline of the daily up channel from May.
The downward reversal from this resistance created the daily Japanese candlesticks reversal pattern Bearish Engulfing.
Given the weakening daily Momentum (showing bearish divergence), Platinum can be expected to fall to the next support level 1350.00 (low of the previous correction 4).
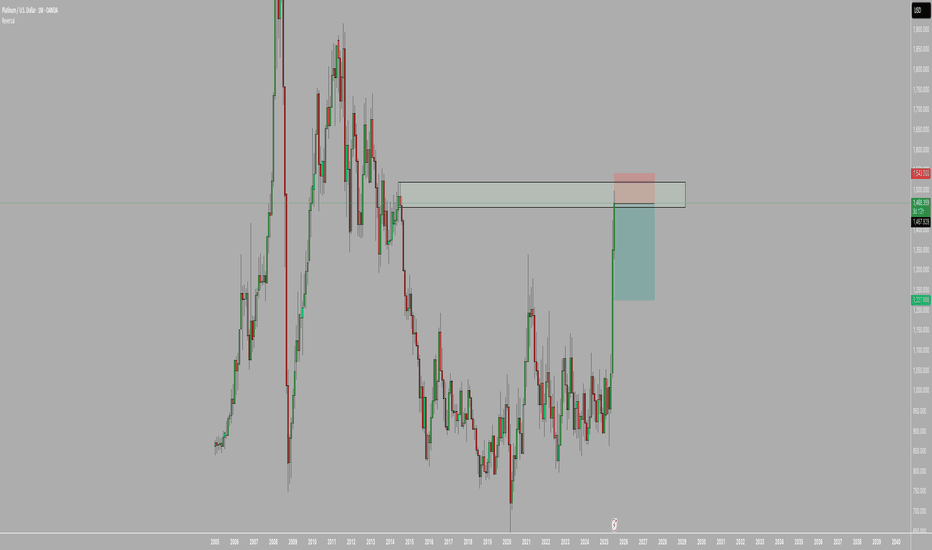
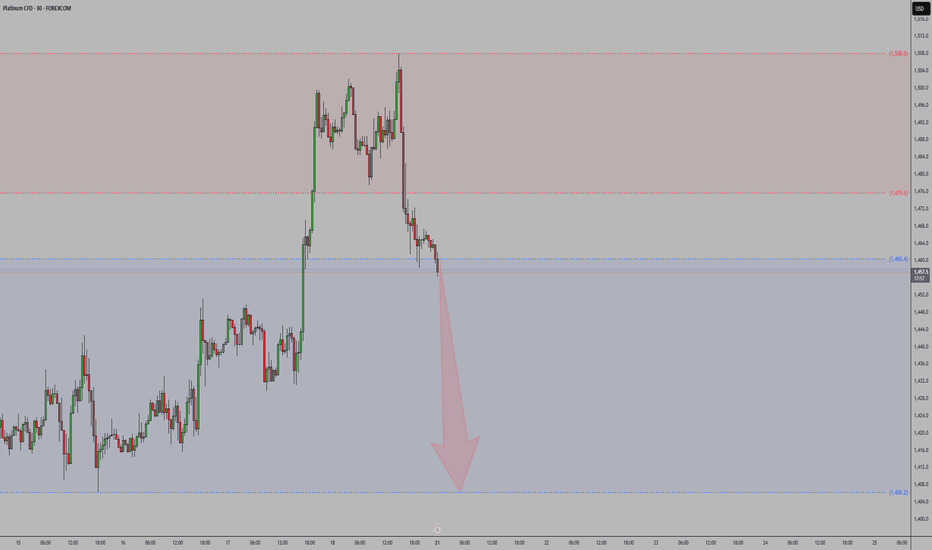
Platinum SellI'm taking this sell trade on platinum because, after a strong three-month rally, the price has now reached a key resistance zone that has historically seen significant selling pressure—most notably back in August 2014. Given the extended bullish move and the fact that we're approaching a major supply area, I anticipate potential profit-taking or a retracement from this level. That makes it a favorable zone for a short setup.
Platinum Wave Analysis – 31 July 2025- Platinum broke support zone
- Likely to fall to support level 1200.00
Platinum recently broke the support zone located between the key support level 1340.00 (low of the previous minor correction iv) and the support trendline of the daily up channel from May.
The breakout of this support zone accelerated the c-wave of the active ABC correction 4.
Given the bearish sentiment across the precious metals markets, Platinum can be expected to fall to the next support level 1200.00 (target for the completion of the active wave c).
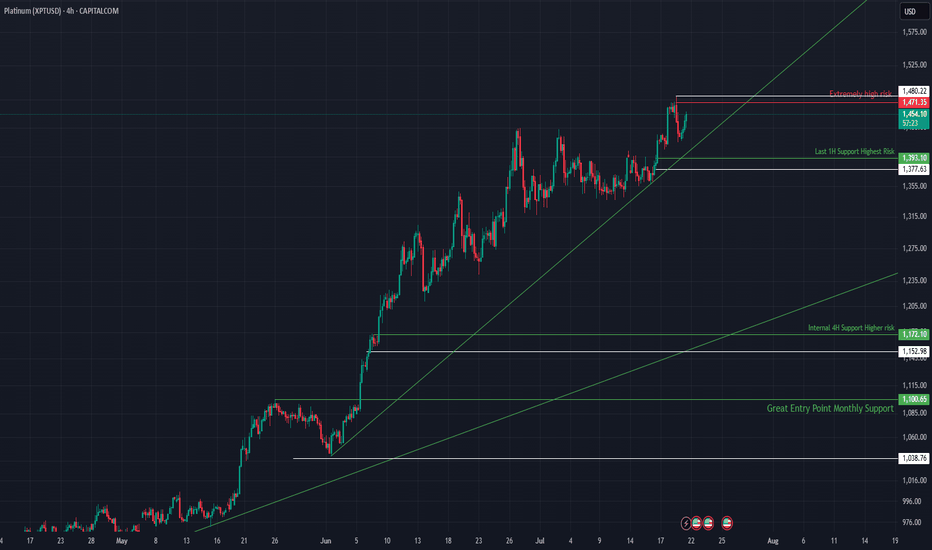
XPTUSD Consolidates Below Light Resistance Within Bullish Struct📈 XPTUSD Hovering Below Light Resistance, Structure Remains Bullish
Platinum is consolidating beneath a relatively light resistance zone after an extended rally, maintaining a strong bullish structure supported by rising trendlines and stacked demand zones. With price action still above key support, bulls are in control unless structure breaks. This publication outlines the levels to watch and the broader market context.
🔍 Technical Analysis:
XPTUSD is currently trading just under $1,471, a mild resistance zone marked on the chart. While price has yet to break through decisively, the rejection so far lacks strong volume, suggesting the resistance may not hold for long.
The overall trend remains bullish, with higher lows forming along the ascending trendline. As long as the structure remains intact and price holds above the key 1H and 4H supports, bulls can aim for a breakout continuation.
🛡️ Support Zones (if pullback occurs):
🟢 $1,385.84 – Last 1H Support (Highest Risk)
Quick-response zone. Valid for scalps or short-term setups.
Stop-loss: Below $1,375
🟡 $1,172.10 – Internal 4H Support (Higher Risk)
Good structural base. Aligned with ascending support trendline.
Stop-loss: Below $1,150
🟠 $1,105.05 – Monthly Support (Great Entry)
Strong macro demand zone. Ideal for long-term swing positioning.
Stop-loss: Below $1,085
🔼 Resistance Levels:
🟥 $1,471.35 – Light Resistance Zone
Currently capping price but lacks strong rejection. Break above could accelerate trend.
🧭 Outlook:
Bullish Case:
Hold above $1,385 and break through $1,471 leads to a renewed bullish impulse.
Bearish Case:
Break below $1,385 may trigger correction into the $1,170 or $1,105 zones before resumption.
Bias:
Bullish while price holds above $1,385 and trendline remains unbroken.
🌍 Fundamental Insight:
Platinum remains supported by constrained supply and robust industrial demand. Expectations of rate cuts and softer inflation also add tailwinds. However, rising dollar strength or sudden shifts in risk appetite could challenge short-term momentum.
✅ Conclusion:
XPTUSD is consolidating below mild resistance, maintaining a healthy bullish structure. A break above $1,471 could confirm trend continuation. Bulls are in control unless $1,385 and the ascending trendline are lost.
Not financial advice. Like & follow for more structure-based insights on FX and commodities.
Platinum Still Has Room to RunJust like with silver, the potential for further growth in gold remains, despite the setbacks of recent days.
It seems the precious metals market didn’t mourn the Fed’s decision and subsequent press release for long.
The uptrend remains intact, and the previously supportive factors are still in play.
Even amid the negative news, there was no sharp sell-off — everything stayed within the trend. This clearly signals that rate cuts are on the horizon, and metals are likely to continue their upward move.
I’m in favor of continued upside.
Stop-loss is placed below yesterday’s low — now we wait for higher levels.
Platinum drops after NFP beat: Is it time to buy the dip or waitPlatinum bounced after a sharp correction but it is not sitting at a major support level. With NFP data stronger than expected and unemployment dropping, the dollar could rise—but momentum in platinum is still holding. We explore two setups: early dip buying and a safer breakout trade above the recent highs. Watch the full analysis and share your view in the comments.
Possible target ~$1800Platinum is breaking out on weekly and daily time scale our of ascending triangle and channels with big volumes.
multiyear breakout possible with high certainty as geopolitical situation will change the things for long as low trust environment (which is not new) but now with attack on Iran, and Ukrain Russian prolonged war and support to Ukraine by many big countries will change the relation for long, specially high tech items, metals and minerals.
Target based on rounding bottom pattern for multiyear breakout. In future it can surpass gold given its ornamental value and almost zero metal loss due to scratching over time.
Fatty Platty PattyPlatinum
Is it time, Sir?
bodl and hodl thx
Look, Sir, chart description must be satisfying some certain minimum character limit. Therefore I tell you, buy Sir, buy. Based on this one descending line, Sir. We are in breakout mode, Sir, with confluence of averages most beautiful, Sir. The time for acquiring shiney metal is coming, Sir. This is not financial advice, Sir.
XPTUSD 1W:While Everyone Watches Gold, Platinum Quietly Wakes UpGold gets the headlines — but platinum just broke two years of silence with a clean, high-volume breakout from a symmetrical triangle on the weekly chart. And this isn’t noise — this is the structural shift traders wait for.
Price has been coiled inside a compressing wedge since early 2022. Equal highs. Equal lows. Stop hunts both ways. The classic “shake out before take off.” Now? The breakout is in. And the weekly candle closed above resistance with volume confirmation. Oh, and while we're at it — the 50MA just crossed above the 200MA, signaling a long-term trend reversal.
Target? Measure the triangle height: ~398 points. That projects a breakout target of 1440 USD, which aligns perfectly with previous institutional rejection zones.
But this isn’t just about the chart.
🔹 South Africa, the top global supplier, is struggling with energy and production cuts;
🔹 The Fed is pausing rate hikes — the dollar weakens, metals rally;
🔹 Demand from hydrogen tech, clean energy, and industrial catalysts is on the rise.
Translation? Smart money has been accumulating. The move from 965–1070 was just the ignition. The drive hasn’t started yet.
So while everyone fights over gold highs, platinum sits at the base of a move no one's prepared for — except those who know how accumulation ends.
🧭 Key support: 965–985
📍 Resistance zone: 1150–1180
🎯 Measured target: 1440+
Platinum trade review and new setupLast week we called the dip in Platinum. In this video, I break down how the trade idea played out, the different ways you could have entered, and what to watch next. We also look at the weekly chart, Fibonacci levels, and key support zones to prepare for the next move. Still bullish, but execution matters.
This content is not directed to residents of the EU or UK. Any opinions, news, research, analyses, prices or other information contained on this website is provided as general market commentary and does not constitute investment advice. ThinkMarkets will not accept liability for any loss or damage including, without limitation, to any loss of profit which may arise directly or indirectly from use of or reliance on such information.
Platinum Wave Analysis – 24 June 2025- Platinum reversed from the support area
- Likely to rise to resistance level 1350.00
Platinum recently reversed up from the support area between the upper trendline of the recently broken up channel from May (acting as the support after it was broken) and the support level 1250.00.
The upward reversal from this support area continues the active minor impulse wave 5 from the end of May.
Given the strong daily uptrend, Platinum can be expected to rise to the next resistance level 1350.00 (which stopped the previous impulse wave i).
Platinum hits key levels: what comes next?Platinum reached our 1128 target after a textbook breakout. Now what? Watch as we map the next move using technical patterns and inflation-adjusted charts.
This content is not directed to residents of the EU or UK. Any opinions, news, research, analyses, prices or other information contained on this website is provided as general market commentary and does not constitute investment advice. ThinkMarkets will not accept liability for any loss or damage including, without limitation, to any loss of profit which may arise directly or indirectly from use of or reliance on such information.
Platinum Wave Analysis – 12 June 2025
- Platinum broke resistance zone
- Platinum to rise to resistance level 1350.00
Platinum continues to rise strongly after the recent breakout of the resistance zone between the key resistance level 1200.00 and the resistance trendline of the accelerated up-channel from May.
Platinum previously broke another up channel from April – which signalled the acceleration of the active impulse waves 5 and (3).
Platinum can be expected to rise to the next resistance level 1350.00 (target price for the completion of the active impulse waves 5 and (3).
Platinum 10 years accumulation 2 000 USD Overview of Catalysts
Here’s a detailed look at the top 10 key catalysts influencing platinum prices—and how they stack up on a 0–10 impact scale 🎯.
1. Supply Deficits (Mining Shortfalls) ⛏️
Trend: Persistent structural deficits—the largest since 2013—with a projected deficit of \~598 koz in 2024.
Drivers: Declining output in South Africa and Russia, underinvestment, and aging mines.
Impact Score: 10/10 – Direct upward pressure on price.
2. Industrial Demand & Green-Energy Growth 🏭
Trend: Industrial consumption is booming, with strong growth in sectors like wind turbines, glass, and electronics.
Support: This broad demand fuels a large part of the supply deficit, and goes well beyond automotive use.
Impact Score: 9/10 – Strong structural support.
3. Auto Catalyst Substitution (Pd → Pt) 🔄
Trend: Cost-effective substitution as platinum approaches price parity with palladium; significant volume was substituted in 2023, with more projected for 2024.
Significance: Boosts automotive demand in an area previously dominated by palladium.
Impact Score: 8/10.
4. Electric Vehicle Adoption (EVs) ⚡
Trend: EVs don’t use platinum in catalytic converters, which is a structural hit to demand as EV growth continues.
Significance: Long-term downside pressure.
Impact Score: 7/10.
5. Hydrogen Fuel Cell Demand 💧
Trend: Hydrogen vehicles use platinum, with projected demand growth toward 2030.
Limitations: Growth remains slower than battery EVs.
Impact Score: 6/10.
6. Recycling Constraints 🔄
Trend: Recycling, which provides about a quarter of supply, is falling due to fewer end-of-life vehicles and glass, reducing the supply buffer.
Market Effect: This amplifies supply tightness.
Impact Score: 6/10.
7. Chinese Emission Policies 🏭
Trend: China’s tightening emissions regulations are supporting demand, with end uses well protected against a slowdown.
Importance: China is the largest platinum user; policy gives stability.
Impact Score: 7/10.
8. Jewellery & Investment Trends 💍
Trend: Jewellery demand remains steady, and investment demand is rising.
Note: This is a smaller demand segment, but it is supportive.
Impact Score: 5/10.
9. Macroeconomic & Auto Production Outlook 📉
Trend: Weak global auto production is lowering platinum use, but recovery in auto could lift demand.
Aftermath: Economic rebound could support prices.
Impact Score:** 5/10.
10. Speculative Sentiment & Positioning 📈
Trend: Inventories are depleted; investors are waiting for a breakout.
Tipping Point: A price surge could spark momentum-driven demand.
Impact Score:** 4/10.
| Rank | Catalyst | Score (/10) |
| ---- | ---------------------------------- | ----------- |
| 1 | Supply Deficit | 10 |
| 2 | Industrial / Green-Energy Demand | 9 |
| 3 | Auto Catalyst Pd → Pt Substitution | 8 |
| 4 | EV Adoption (Negative Impact) | 7 |
| 5 | Chinese Emission Policies | 7 |
| 6 | Hydrogen Fuel Cell Growth | 6 |
| 7 | Recycling Constraints | 6 |
| 8 | Jewellery & Investment Demand | 5 |
| 9 | Macro Slowdowns / Auto Production | 5 |
| 10 | Speculative Positioning | 4 |
📌 Key Insights & Outlook
* Tight supply and diversified demand—especially from green energy and industrial sectors—are the strongest bullish forces for platinum.
* Auto-driven substitution offers further upside, while EV growth and recycling limitations act as constraints.
* Chinese regulations add resilience; hydrogen offers potential if growth accelerates.
* Jewellery and investment flows remain minor but supportive.
* Much depends on auto sector recovery and investor psychology—momentum effects could amplify gains if technical levels break.
🔮 Final Take
Platinum remains positioned for medium-term strength, thanks to severe supply tightness and robust non-auto demand drivers. For investors, key areas to watch are further deficits, industrial trends, and catalytic substitution. Be mindful of potential headwinds from EV adoption and macroeconomic softness, but the structural case remains compelling.


