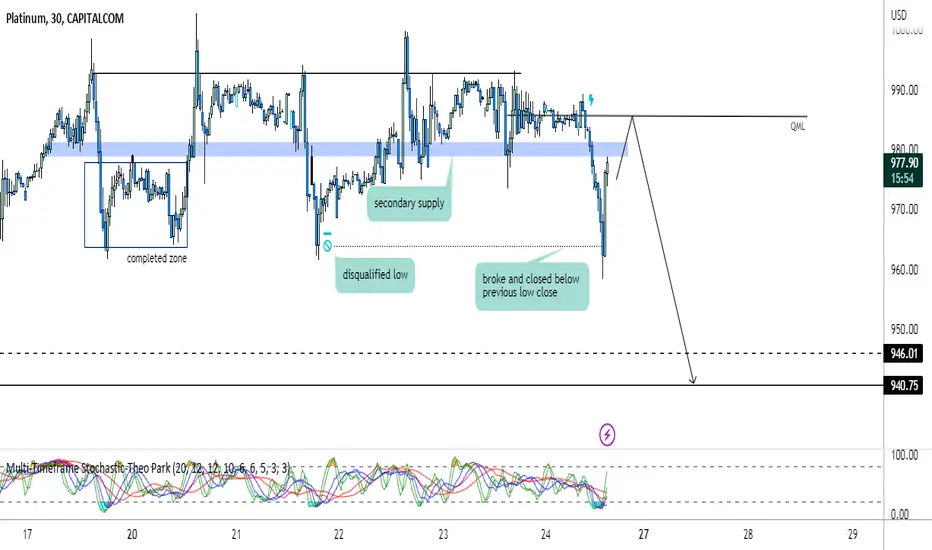
Platinum Forecast SND ConceptsPlatinum appears bearish at the M30, but it needs a clear bearish pullback and the target level is 946.01
XPTUSD trade ideas

Platinum USD / XPT /USDJust another reference for myself. Still watching the 800 EMA as an area of support as it begins to curl bullish. I expect this year to be a great accumulation time before a double bottom in the $890 / $900 range and quick spike nearing Fall 2023 / early 2024.
The weekly and monthly time frames on platinum/XPT show me tremendous long term strength and a textbook pattern

Does Platinum rhyme with Bailout?Mo money Mo problems.
The philosopher Notorious B.I.G. used to sing about that.
With the unlimited backstops to deposits and blank checks being thrown around, it might be a good time to review metals.
Platinum is more rare than gold.
Historically it has traded at a premium to the gold price. Currently trades for about half the gold price.
All time high in platinum is 2290, but those dollar were pre 2008 bail out dollars.
As gold nears all time highs over 2k, I cant help but wonder what could happen with Platinum.
in inflationary times metal do pretty well historically.
and since deflation is being bailed out with the banks, the inflation case is more likely now than last month.

PLATINUM SHORTWith the bank failures we've already experienced in the US and abroad, the markets are going to be volatile for the foreseeable future. We should see a sharp decline in metals as larger positions liquidate to cover other positions, as well as selling shares into the market as short positions increase could create a perfect storm.

XPTUSD - Knocking 970 door.After breaking the falling channel, xpt is knocking 970 resistance. If we break here 983 would be initial target. It may follow towards 1030, monthly resistance point.

Platinum Bullish Flag Set to Become a 5-wave CorrectionThe bearish price action in TVC:PLATINUM that started since Feb 2021 has the hallmarks of a bullish flag:
Overlapping waves WXYXZ
No significant price movement compared to the bullish impulse from Mar 2020 to Feb 2021.
It has taken more than 2x the time to retrace 61.8% of the previous impulse move.
Forecast:
Platinum breaking below the previous low ($825), potentially hitting the $700 area near the bottom trendline of the channel
Platinum bottoming at the Z wave
The price bouncing back targeting the upper trendline as the first target and the previous high ($1336) as the second target.

Doctor Platinum Platinum is the bellwether for the Fourth Industrial economy
Green hydrogen is the battery for the storage and transportation of wind and solar energy; and platinum is the chief catalyst for both the generation by electrolysis of green hydrogen from solar and wind energy; and the reverse reaction in the fuel cell.
Here I have a section of the longterm platinum chart in log: comes down to recent PA
We can see it is respecting the longterm geometry perfectly
Since the corona low it has made a high and it now attempting a higher low; the golden pocket should again provide good support
The purple median line should act like a magnet to prevent and further big drops near term- I believe the higher low is in; and I’ll be buying here. A sensible stop would be around the last low. I don’t use stops.
NOT TARDING ADVICE
GR Industry 4
PT1 = 1500
PT2 ATH

PLATINUM - Area of InterestPlatinum currently -14.36% from the beginning of the year swing high and the PGM companies similar downward pressure.
We at a 'possible" support zone but a 2 day close above the 10ema will be required for a start.
Oscillators signalled very oversold.

Plat finding supportThe price of platinum has since January 2023 nose-dived by roughly 16% which has seen the metal fall below its 200-day MA price of $947.60 to touch lows around $910 in Feb. The metal is however finding some support on the green 61.8% Fibo retracement level of $922.85 and the longer-term blue 23.6% Fibo.
Technical indicators are supporting a move higher for the metal with a re-test of the 200-day MA looking likely over the near-term. A break above the 200-day MA price will allow the metal to claw its way higher towards the 50-day MA price currently at $1012.03 in my view. The heavily oversold daily RSI and the rolling over of the MACD indicator supports this price action, but for now we need $922.85 to hold its ground.
(I’m not too familiar with the fundamentals regarding precious metal prices, some references or pointers would be greatly appreciated. I mainly watch the price of plat to support my USDZAR views)

XPT/USD is starting to enter Advancing phase of MarketXPT/USD was clearly in bearish trend but it failed to form new Lower Lows and broke the previous Lower High signalling that the trend is now shifting. I would place new buy order above the new formed Higher High. My trade would be:
Buy: 943.13
Stop Loss: 927.80
TP 1: 958.40
TP 2: 973.40

PLATINUM: 2023 Yearly Forecast1. Resisted at top of major trendline
2. Price closed below Kijun Sen (Green Line) & Tenkan-Sen (Blue Line)
3. Ichimoku Death Cross
4. Chikou Span Below candles
5. Target 827.29

Platinum: Potentially Nearing OversoldThe majority of my research insights are published for clients and occasionally highlighted on this platform. To become a regular recipient of my research, including trade ideas, get in touch with me today for a brief discussion.
Price momentum is down however the indicators point to the commodity nearing oversold conditions
Nearing incline support
Is trading just below the 61.8% Fibonacci retracement level
Consider the following for today or in the next 2 to 3 sessions: the development of a piercing candle formation i.e. a print below the prior day low and a reclaim of those lows to suggest that buyers have started to step in.
Traders could consider building a small buy/long position on confirmation/improvement in the price action or structure.

False penetration After it did false penetration the price came back again inside the canal, that will give us a sign the there is more falling down, the first target will be 974

Platinum nascent bull market I’m a metals bug but haven’t been convinced of a full blown metals bull market since corona
Now I believe is time
Inflation is now dialled in, but they can’t keep raising ad infinitum else the web of debt financial system will collapse
It may be that endogenous financial ruin is part of the reset- but I don’t believe the comptrollers would risk their own wealth to do this
It will be more subtle
Platinum has the additional fundamental of green hydrogen
I think metals are preparing for a face melting bull run
Ofc this would require general sentiment to be mehish at best, which of course it is
The major downtrend is shown here in orange/brown
It’s had a few goes at breaking this
The corona low was a divergent low
I’ll be surprised if platinum doesn’t have a monster breakout this year
NFA

PLATINUM short term long setupSo, we are at the bottom of the descending channel + a very strong support level. We might see one more bounce or 4H hammer candle before going up and to be honest that's the optimal play we look for. The price can actually smash this zone and if it does so, I will shift my bias and will look for pullbacks for short.

Platinum attempting to end its bear market Platinum is attempting to break our of its longterm bear market
I don’t believe the corona low will be revisited
I also think the reversal at the golden pocket was significant
I’d expect it to bottom on this local correction close to 900
BTD
NOT TARDING ADVICE

XPTUSD Up.Textbook trade.
First leg down full force sets bar. Second leg cannot go past it and reverses.

Platinum price has an exciting chart1. Platinum price is In a broader upward trend.
2. It is approaching the middle line of the regression trend.
3. Moved above the 61.8% Fibonacci retracement level.
4. Supported by trend indicators.

Correction Coming...5 waves up and in the process of correcting this whole move - expecting lower prices to come.

Platinum long scenario Oke guys, I'm going to watch this for potential long if price give us second touch of the ATL, it showed good rejection at first touch and now I'm looking for a pullback to POI and if it comes to the marked zone, I will wait for 4H rejection candles and after that I'll consider buys.
Confluences are:
1. Daily 50EMA touch
2. Nice break and retest of S/R zone
3. Bullish trend on 4H, D, W
4. 61.8% fibs
5. initially it showed rejection at the first touch of daily 50EMA
Technically its looking good, but remember that we jump in longs only if we see a good 4H rejection candles at marked zone

XPTUSDPotential movement upward. has broken the trend line and did a retest which can be used as a confirmation.

Going short on PlatinumThe metal shows strong set of lower highs complaint with Fibonacci retracement levels. Current bounce back from fib resistance followed by bearish candlesticks are a strong indication for going short in this commodity
