Platinum Bullish GartleyI think that after the accumulation period, Platinum prices will head towards the Bullish Gartley target.
* What i share here is not an investment advice. Please do your own research before investing in any asset.
* Never take my personal opinions as investment advice, you may lose all your money.
XPTUSD trade ideas


Platinum towards Key Resistance. Watch Closely for Confirmation OANDA:XPTUSD is approaching a significant resistance zone, an area where sellers have previously stepped in to drive prices lower. This area is a great zone to watch for potential rejection.
If price struggles to break above and we see bearish confirmation, I anticipate a pullback toward the $1,010 level at least. In this recording I will be explaining in more detail why I think this is a possibility and what to look for.
This is not financial advice but rather how I approach support/resistance zones. Remember, always wait for confirmation before jumping in.

Platinum Approaching Key Resistance — Will It Drop to 1,010$?OANDA:XPTUSD is approaching a significant resistance zone, an area where sellers have previously stepped in to drive prices lower. This area has historically acted as a supply zone, making it a key level to watch for potential rejection.
If price struggles to break above and we see bearish confirmation—such as rejection wicks, a bearish engulfing candle, or weakening bullish momentum—I anticipate a pullback toward the $1,010 level. However, a strong breakout and hold above resistance could invalidate the bearish outlook, potentially opening the door for further upside.
This is not financial advice but rather how I approach support/resistance zones. Remember, always wait for confirmation, like a rejection candle or volume spike before jumping in.
Please boost this post, every like and comment drives me to bring you more ideas! I’d love to hear your perspective in the comments.
Best of luck , TrendDiva

Platinum Testing Key Resistance - Reversal Ahead?OANDA:XPTUSD has reached a major resistance zone, where sellers have previously taken control. The current rally has been strong, but this level could act as a turning point if buyers start losing momentum.
If we see bearish confirmation—such as rejection wicks, bearish engulfing candles, or a drop in volume—I anticipate a move toward $971.78 level. A clear rejection here could fuel selling momentum, leading to further downside. However, if price breaks and holds above the zone, the bullish trend could extend higher.
This is not financial advice but rather how I approach support/resistance zones. Remember, always wait for confirmation, like a rejection candle or volume spike before jumping in.
Please boost this post, every like and comment drives me to bring you more ideas! I’d love to hear your perspective in the comments.
Best of luck , TrendDiva

PLATINUM Buy signal on the 1D MA50.Platinum (XPTUSD) is ranged lately within the 1D MA50 (blue trend-line) and 1D MA200 (orange trend-line) but with its 1D RSI rising steadily since the December 30 2024 Low. That was the technical bottom of the Falling Wedge pattern that broke upwards.
As you can see, this has been a very common pattern since September 2023, with all Falling Wedges eventually breaking to the upside to hit at least the 1.618 Fibonacci extension. As a result, our current short-term Target is $999.50.
-------------------------------------------------------------------------------
** Please LIKE 👍, FOLLOW ✅, SHARE 🙌 and COMMENT ✍ if you enjoy this idea! Also share your ideas and charts in the comments section below! This is best way to keep it relevant, support us, keep the content here free and allow the idea to reach as many people as possible. **
-------------------------------------------------------------------------------
💸💸💸💸💸💸
👇 👇 👇 👇 👇 👇

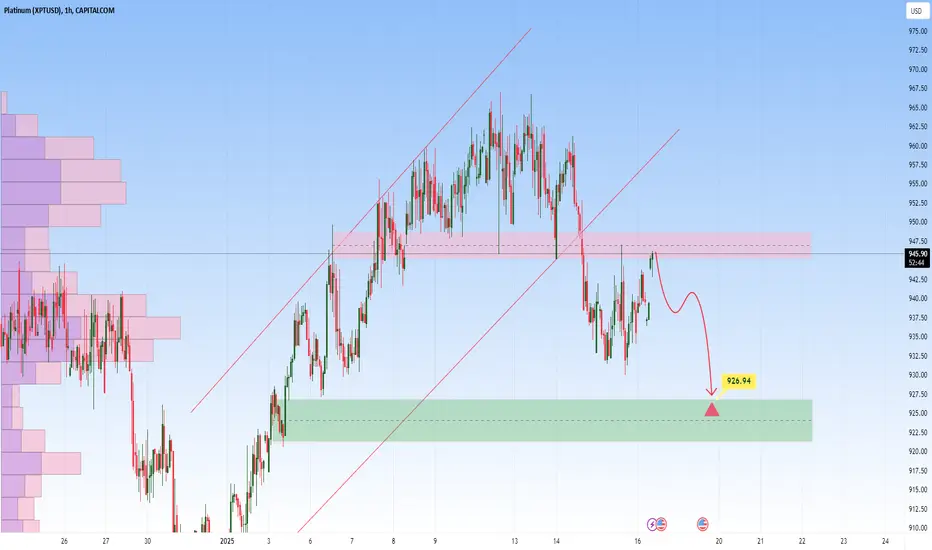
Platinum – Potential Short Setup with RetestPlatinum is currently trading below a key resistance zone, following a breakdown from the ascending channel. The recent bearish momentum indicates the potential for a continuation lower if the price fails to reclaim the resistance zone.
If the price retests this zone and shows rejection signals—such as bearish wicks, engulfing candles, or decreased buying pressure—it would strengthen the case for a short trade. In this scenario, the next target for sellers would be the $926.94 support zone, where buying interest may re-emerge.
This setup aligns with the broader bearish structure following the channel breakdown. Traders should monitor price action closely at the resistance level for confirmation of rejection before entering short positions.
Platinum / USD 4hr Long BiasPlatinum has formed an ascending channel and is currently reacting to a demand zone. I expect the price to rise in the near future toward the next supply zone.

105R Platinum LongHigh risk trade.
Long term timeframe is bullish.
Wedge pattern on 15min timeframe.
15% chance of success.


90R Platinum15% chance of success.
Wedge pattern on lower timeframe.
Long term time frame is bullish.

90R Platinum15% chance of success.
Wedge pattern on lower timeframe.
Long term time frame is bullish.

08.01.25 Morning ForecastPairs on Watch -
FX:NZDJPY (Live)
FX:GBPUSD
OANDA:XPTUSD
I will be recording a trade recap video of a UK100 position I took yesterday with the NZDJPY position I also took today this week.
A short overview of the instruments I am looking at for today, multi-timeframe analysis down to what I will be looking at for an entry. Enjoy!

Platinum bullish from every timeframe however you look at the platinum chart you can't shake the bullishness, diverging monthly RSI, pivotal covid low, huge flag, multiple Inverse head and shoulders formations. All targeting 1750$


Platinum's return...This has been a hundred year old squeeze, we might be at the very end this year. Tight stops please...


Platinum BULLmajor reversal weekly candle as previously expected, should this candle close anywhere above 927, expect sustained upside move in the price of platinum to at least 1040 and a major target of 1300
high probability trade: buy the retracement between 910 and 922 after the weekly close above 927, with Stop weekly close below 890

Platinum Platinum to me , looks like it wants to go for a cup and handle pattern .
A sharp rise , with a sharp ( short ) decline in the crisis Q2-Q3 .
But platinum ( all metals ) recover as one of the first and go on to see the best * after crisis appreciation * .
First stop -1300$ , back to -960$ , second stop -2500$
( 150% is what it did after 2008 )

Macro View on Platinum...Not for the Weak Minded..This is what the future is for Platinum. This is an opportunity for strong minded individuals. Most of you are weak minded are paper handed...Most people will FOMO into crypto and lose a lot of value...Only the strong minded people who know how the world works will see this opportunity.

Platinum is a solid BUY BUY BUY!The current platinum versus silver chart is screaming to scoop up as much platinum as you can to eventually stack more silver in the future!
Benefits of the Platinum vs. Silver Chart
Historical Ratio Analysis:
The platinum-to-silver ratio measures how many ounces of silver you can buy with one ounce of platinum. Historically, this ratio fluctuates, and investors use it to identify relative overvaluation or undervaluation.
For instance, if the ratio is unusually low (platinum is cheap compared to silver), it might signal a buying opportunity for platinum. Conversely, if the ratio rises significantly (platinum becomes expensive relative to silver), you can trade platinum for silver, acquiring more silver than you started with.
Market Cycles and Arbitrage Potential:
Precious metals don't move in lockstep; they react differently to economic conditions, industrial demand, and market sentiment. Trading between them based on their relative values allows you to profit from these cyclical differences.
When platinum is undervalued (as it is now compared to historical averages), it offers more potential for appreciation.
Diversification and Inflation Hedge:
While silver has high industrial use, platinum’s demand is growing in sectors like automotive (catalytic converters) and hydrogen energy, diversifying your exposure to economic trends.
Both metals are excellent inflation hedges, but diversifying into platinum can reduce risks tied to the specific dynamics of the silver market.
Asymmetrical Upside for Platinum:
Platinum has been historically undervalued compared to gold and silver, meaning its upside potential in a bull market could outpace silver. By investing in platinum now, you're positioned to benefit from a possible price correction.
Clear Buy for Platinum (Current Market Analysis)
Low Price of Platinum Relative to Silver:
If the platinum-to-silver ratio is near historical lows, platinum is likely undervalued. Buying platinum now means you’re acquiring an asset with significant growth potential.
Potential to Accumulate More Silver:
As the platinum-to-silver ratio rises in the future (when platinum becomes overvalued relative to silver), you can sell or trade platinum for silver. This allows you to increase your silver holdings without additional capital.
Illustrative Example
Current Situation:
Platinum is trading at $900/oz.
Silver is trading at $25/oz.
Platinum-to-silver ratio: 36:1 (36 ounces of silver per ounce of platinum).
Future Projection:
If platinum rises to $1,800/oz and silver increases only to $30/oz:
Platinum-to-silver ratio becomes 60:1 (60 ounces of silver per ounce of platinum).
By trading 1 ounce of platinum, you can acquire 60 ounces of silver, compared to only 36 ounces today.
Outcome:
You’ve increased your silver holdings significantly by taking advantage of the price ratio.
Why Platinum Now?
Undervalued Relative to Silver and Gold: Platinum is priced lower than gold and silver on a relative basis, which historically is an anomaly.
Growing Demand: Industrial and green energy applications are expected to boost platinum demand.
Scarcity: Platinum is much rarer than silver, adding to its long-term value potential.
By monitoring the platinum-to-silver ratio and understanding market cycles, you can leverage the undervaluation of platinum to maximize your holdings of both precious metals over time.

Platinum - Outlook for 2025Trade Idea:
After falling wedge Breakout and retest
BUY at 947
TP 1020
SL 910

Platinum in deep consolidation TerritoryThe 70% to drop after my Nov 18th post turned out to be 100%
Now we are in deep consolidation going into the closing of this yearly candle
I predict we will drop further coming into the year but a sweep of the highs first.
There is actually no real way to predict which side will unload 1st to start the volatility so we remain cautious and super suspicious of the low volume going into the new year
