Platinum, ill buy at 938!!!Looks like we made a wave 1 (12345). Now making a abc correction and in the wave C wiche has 5 waves. Im looking to buy exactly at 938. If it goes lower then to bad. Then find lower levels to buy. Use stoploss!! Almost weekend!
XPTUSDG trade ideas

Platinum's Path: Channel Support Holds with Bullish DivergencePlatinum is currently trading within a well-defined channel, consistently respecting both support and resistance levels. A bullish divergence has recently emerged, adding strength to the case for a potential upward move. This divergence suggests possible buying interest at the lower boundary of the channel, which could lead to a bounce.

Platinum Rally: Diverging From SupportPlatinum has reached a significant support level and is currently forming a bullish divergence. This technical pattern suggests a potential upward movement.

Platinum: Divergence Confirmed with Trendline BreakThis chart illustrates a notable divergence in Platinum, which has recently broken below a key trendline. This technical signal may indicate a potential reversal or shift in market sentiment.

Platinum: Relevance in Latin AmericaPlatinum (Ticker AT: PLATINUM) , a highly versatile precious metal, has experienced considerable price volatility, influenced by economic and geopolitical factors, as well as changes in industrial demand, especially in the automotive sector. Unlike gold, which is seen primarily as a safe haven, platinum serves a dual function: as an investment asset and as a key input in a number of industries, particularly in automotive and clean energy technologies. In recent years, its demand has been driven by the transition to more sustainable energy and low-emission technologies.
Industrial Use of Platinum and its Growing Demand in the Automotive Sector
Platinum group metals, such as platinum, palladium, rhodium, ruthenium, iridium and osmium, possess unique properties, including high corrosion resistance, catalytic efficiency and electrical conductivity. These characteristics make them indispensable for applications in industries such as automotive, electronics, medical devices and jewelry. In the automotive context, catalytic converters made from platinum and platinum-based metals are crucial for reducing pollutant emissions, especially in diesel vehicles. Increasing environmental regulation in regions such as Europe and Asia has driven their demand, as these converters meet increasingly stringent emission standards. However, the transition to electric vehicles could reduce their use in the long term, generating uncertainty in future demand.
In Latin America, this trend is also relevant, especially in countries that depend on the export of precious metals and seek to diversify their resource base. In addition, in countries such as Brazil and Mexico, where the automotive industry is key, the adoption of cleaner vehicles could open new opportunities for the use of PGMs in hybrid and low-emission technologies.
Platinum Supply and Production Factors in Latin America and the World
Platinum production is concentrated in South Africa and Russia, making it vulnerable to fluctuations in supply due to geopolitical tensions and local factors. In South Africa, labor problems and a lack of investment in mines have generated uncertainty in supply, while sanctions imposed on Russia have also reduced the availability of this metal on the world market. Latin America, while not a major platinum producer, has potential to explore the use of PGMs in industrial and clean technology sectors.
In addition, Latin American companies could benefit from the technology and investments of multinational companies in refining and manufacturing processes using PGMs, thus strengthening the regional supply chain. Chile and Peru, with their advanced mining sectors, have opportunities to diversify into PGMs, especially considering their proximity to the U.S. and Asian markets.
Platinum as an Investment in Times of Uncertainty
Although platinum is not typically viewed as a safe haven asset like gold, it has proven to be a reliable asset for asset diversification in times of economic uncertainty. Monetary policies in large economies, such as the United States, can have a significant impact on its price, as a reduction in interest rates could increase demand for precious metals. In Latin America, institutional investors are increasingly interested in PGMs as alternative assets in a context of volatile markets, considering their appreciation potential.
Clean Energy Innovation: New Opportunities for Platinum in Latin America
The transition to renewable energy offers a positive outlook for platinum, particularly in the development of fuel cells for hydrogen vehicles and in electrolysis processes to produce green hydrogen. This emerging demand could benefit Latin American countries seeking to develop sustainable technologies. Brazil and Chile, for example, have begun to explore green hydrogen and could increase their consumption of platinum for these purposes in the coming years, given their interest in leading the region in clean energy production.
Technical Analysis
Platinum (Ticker AT: PLATINUM),since last year has been moving in a sideways range between $1,093.33 and $838.34 having peak moments this year on May 20, generating a support supported twice in August and September respectively around $908 very close to the control point (POC) of $922. At the moment the asset has evolved downwards due to the fall in demand for vehicles as we have previously mentioned, it was oversold and the RSI confirmed it on the 29th so the price corrected to its trading area up to $984.65 yesterday. Currently the price is moving positive and the RSI is at 48%. Given that the delta pressure zone is bullish it would not be unusual to see it move to the 61.80% Fibonacci retracement around $1011.10. If demand for this product increases in the aforementioned sectors it is possible that the price could regain its last high of $1,093.33.
Top companies in the PGM sector
As a side note it is important to review what moves are being made by the major companies in this sector globally. Among the prominent companies in the PGM market are:
1. Glencore (Ticker AT: GLEN.UK) - Annual revenue: USD 255.98 billion. Producer of platinum, palladium and rhodium with operations in Africa.
2. BASF SE (Ticker AT: BAS.GE) - Annual revenues: USD 72.172 billion. Leader in emission control technologies.
3. Heraeus Group (Private) - Annual revenues: USD 27.7 billion. Specialist in catalysts and electronic materials.
4. Norilsk Nickel (GMKN.ME) - Annual revenues: USD 14.4 billion. Producer of nickel, copper, palladium and platinum.
5. Impala Platinum Holdings Limited (IMP:JNB) - Annual revenues: USD 9.03 billion. With operations mainly in South Africa and Zimbabwe.
6. Eastern Platinum Limited (ELR.TO) - Annual revenues: USD 8.18 billion. Platinum producer in the Bushveld Complex.
7. Northam Platinum Holdings Limited (NPH.JO) - Annual revenues: USD 6.7 billion. Operates some of PGM's largest mines.
8. Johnson Matthey (Ticker AT: JMAT.UK) - Annual revenues: US$5 billion. Innovator in emission and energy storage technologies.
9. Sibanye-Stillwater (JSE:SSW) - Annual revenues: $3.3 billion. PGM miner in South Africa and the United States.
10. African Rainbow Minerals Limited (JSE.ARI/OTC - AFBOF) - Annual revenues: US$1.04 billion. Engaged in PGM mining and processing in South Africa.
Platinum and PGMs represent a strategic opportunity for Latin America, both in terms of investment and diversification of key industries. Their growing demand in low-emission technologies and clean energy, as well as their stability in volatile markets, reinforces their importance as an asset in the region.
Ion Jauregui - ActivTrades Analyst
*******************************************************************************************
The information provided does not constitute investment research. The material has not been prepared in accordance with the legal requirements designed to promote the independence of investment research and such should be considered a marketing communication.
All information has been prepared by ActivTrades ("AT"). The information does not contain a record of AT's prices, or an offer of or solicitation for a transaction in any financial instrument. No representation or warranty is given as to the accuracy or completeness of this information.
Any material provided does not have regard to the specific investment objective and financial situation of any person who may receive it. Past performance is not reliable indicator of future performance. AT provides an execution-only service. Consequently, any person acing on the information provided does so at their own risk.

PLATINUM: Best sell signal of the past 30 days.Platinum is heavily bullish on its 1D technical outlook (RSI = 65.879, MACD = 18.220, ADX = 36.308) as it trades on the bullish wave of the 2 month Channel Up. With the support of the 4H MA50, the price is very close to the top of the pattern. The bullish wave before that, topped upon a +12.17% rise and then pulled back almost to the 0.5 Fibonacci level and the 4H MA200. The current level is already great for a sell entry (if you want you can wait until the RSI gets overbought) and out target (TP = 1,020) is above the 0.5 Fib as the 4H MA200 this time is rising more aggressively than on the previous bullish wave.
## If you like our free content follow our profile to get more daily ideas. ##
## Comments and likes are greatly appreciated. ##

Platinum - Daily Resistance Zone - Bearish Divergence CAPITALCOM:PLATINUM has reached a daily resistance zone and currently slowing down the bullish momentum since the support trend line is broken! Additionally, bearish divergence is also present on the chart and price action indicates incoming bearish momentum since the HL on 4 hr has been broken and retested!

Platinum-XPT- Bearish reversalThis 4-Hour chart of Platinum shows recent price action and key technical indicators. Platinum has been in a bullish trend since the 9-October. Recently it broke a trend line and made a new 'Lower Low' breaking the previous 'Higher Low'.
Currently, it is forming a new 'Lower High'. If it breaks the 'Lower Low', look for a selling opportunity.

Platinum LongLooking to go long on Platinum/XPTUSD.
The metal market is now declining on some profit taking as all have done extremely well in the last month in percentage gain.
With fundamentals aligning cross the metal markets, pre election period, inflation dropping etc. Metals are still bullish, until the narrative has changed officially. This would most likely change if gold breaks below 2700.
While I would normally buy platinum on the 38% fib with the key level present, due to most of the precious metals declining I am avoiding this zone and going for the stronger one.
Confluences for the trade:
- Intra Key level
- Trendline Break Retest
- 50% Fibo
- Palladium Alignment at 50% fibo and Intra Key Level
Entry- 994.72
Stop Loss- 65 pips or $6.50
Take Profit- 1014.86
RR of 3.1
Trade safe and risk managed as always no matter what ya'll are trading, catch you later traders ▲

Buying Platinum from 4 h demand zone - October 25th Qualifiers of Trade
1. Direction - Buy with the trend
2. 4 hours fresh demand zone, covered by Pivot arround 1,000 prive level
3. Risk to Reward 1 to 2
4. Recommend to take profits at 1,027
www.tradingview.com

Platinum On Cusp of MAJOR BREAKOUT!!!! ABCDE Triangle CompletingI have been following this formation for about a year now...its been a nail bitter but now all the puzzle pieces are falling into place...Gold has gone parabolic, Silver is following suit, and Platinum...Well...Platinum is Coiled like a spring ready to take off any moment!!!...This is a 4 year consolidation at decade low prices...this all while the other metals are blasting off...its go time!!!...I am positioned heavy in platinum right now...I have rotated out of gold into platinum.

XPT/USDPrice has broken above the higher timeframe highs and now we can look for shorts. I will be waiting for the 15m flag continuation to take for a reduced risk entry

PLATINIUM / NEW BULLISH IMPULSE AHEADDear Trader,
I'm expecting for 1st step, at this moment from 930-950 area, the price gonna start Upward movement to 1060-1080. /TPs are for 2h/frame/!

Platinum Insider Stays in the Game, Anticipating Higher PricesA platinum Insider hasn't changed portfolio yet, so there's still potential for more growth.
Let me remind you, on September 4th, an insider came into the Platinum market and went long, which caused the price of Platinum (and other precious metals) to go up.
Now, prices are getting close to his target levels. This is important because it shows the market's future direction. The Insider know when to get in and when to get out. And we can watch them to see what he is doing.
If you don't have the time or inclination to read stock reports, just follow us. We cover all the important stuff and provide valuable insights every day.

Platinum (the moment of truth)A large inverse head and shoulders has been in the making with the neckline coexisting with the long term resistance trendline, I think this should mark the breakout to 1130$

XPT Surges as EMAs Align with Bullish Chart PatternH ello!
XPT broke out from a falling wedge (See green trendlines!) formation with strong bull power, as the MACD shows. It wasn't against expectations since falling wedge chart patterns usually break upward. It's often a bullish formation. Thus, MACD and chart patterns align with a bullish outlook. Furthermore, the price is above EMAs (20/50/100/200). EMAs crossed upward on the 24th of September. Seemingly, nothing stands in the path of bulls until the green target circles. However, stay vigilant and don't go all in.
Regards,
Ely

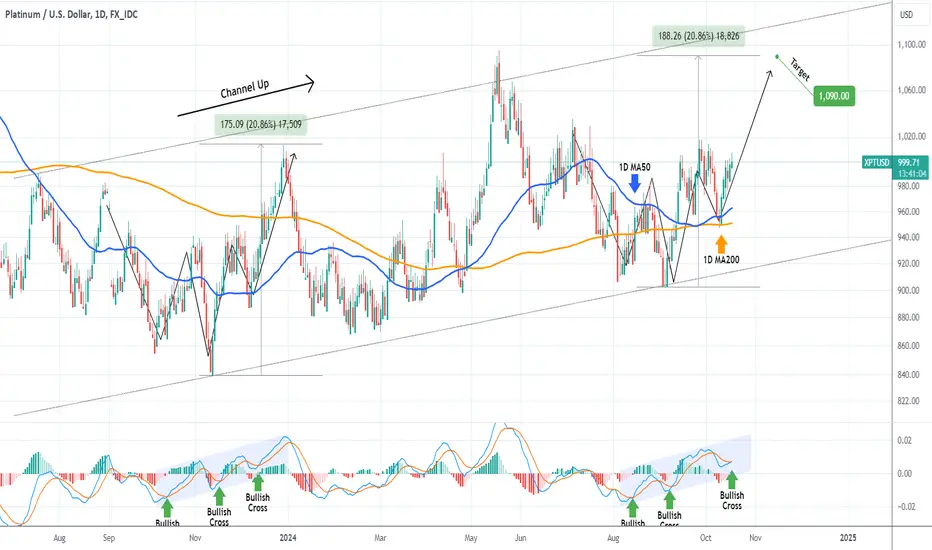
PLATINUM Strong rebound on the 1D MA200.We got a perfect bottom buy entry on Platinum (XPTUSD) last time we analyzed it (August 30, see chart below), with the price already halfway to our 1090 Target:
As you can see, the price action is almost a perfect mirror image of September - December 2023. Now that the price has confirmed the new Bullish Leg with a strong rebound on the 1D MA50 - 1D MA200 zone (blue and orange trend-lines respectively), we can expect it to complete the pattern and complete a +20.86% rise, right where our 1090 Target is.
-------------------------------------------------------------------------------
** Please LIKE 👍, FOLLOW ✅, SHARE 🙌 and COMMENT ✍ if you enjoy this idea! Also share your ideas and charts in the comments section below! This is best way to keep it relevant, support us, keep the content here free and allow the idea to reach as many people as possible. **
-------------------------------------------------------------------------------
💸💸💸💸💸💸
👇 👇 👇 👇 👇 👇
PLATINUM - Short Term Whipsaw TradeThese upper wicked candles (red arrows) have my attention and notice that they make a slightly higher high whereas the RSI makes a slightly lower high.
I have the RSI source set to "high" so that the upper wicks are recorded.
And also a slightly higher high is often Wyckoff liquidity tapping.
Then check the fib retracement and notice that this is all happening at the 0.786 overshoot ratio.
This is an ideal ratio because any higher and then I know the probability of a slump dwindles.
So this is quite a nice setup here I think.
In higher time frame I am bullish Platinum.
But these coiling whipsaws have been going on a very long time so I would be somewhat unlucky if this is leading to a breakout here.
And the wicked candles are signalling this is a point of resistance.
...
So a very short term trade here.
Notice that on the 4 hour chart, every pivot low has been caught by the lower Bollinger Band.
That will be my target.
I will aim slightly higher than the lower band because it is rising @ $973.
Sometimes these trends do move above the 0.786 but anything above around 0.81 generally signals a full retracement will occur ( and so invalidate the trade)...
But even with the stop level as high as 0.84 ratio @$1006, this is still a 3:1 RR trade.
So this is what I'll go with.
A 3:1 trade
TP: $973.
SL: $1006 👍.
Not advice

Platinum breakout is near monthly close above 1000$ will confirm the breakout and price should explode to 1500$

Platinum In Neutral AreaHi there
In the platinum setup, the price could break above or below the trendlines. If it moves above the daily purple trendline, the outlook will be more bullish; conversely, if it falls below the blue trendline, the sentiment will be more bearish.
A break below the weekly trendline would indicate a shift to a bearish trend.
This is a nice set-and-forget type of setup/strategy tip. When you receive an alert, you can gauge how market participants may be feeling about the market. However, always apply risk assessment before entering a trade.
Happy Trading,
K.

Platinum Swing Long. Buy! Hello, my friends!
Platinum is trading along the rising support. I'm expecting the price to reverse and go Up. TP1 980; TP2 1020; TP3 1080; TP4 1150.

[Platinum] Something is brewingWeekly CAPITALCOM:PLATINUM chart: breakout attempt is in progress.
Last breakout in May was unsuccessful, the candle was peeking above the trendline, but dive again the following week. Would we see different result now ? possible as the EMAs are positive and MACD is positive as well.

Platinum could do a mean reversion hereI am looking forward to Platinum doing a mean reversion here on the 1hr timeframe. I expect it to take out the recent high a make a higher high and follow the trend.
