XRP Updated Cycle Wave 5 of Wave 2From the spike we had yesterday, it looks like we have two options. Either we are making an 1-2, 1-2 OR we are not finished with this wave 2.. Considering how fast we went yesterday, usually I don't prefer that to be an impulsive wave. From the many counts and charts Ive studied there is an higher probability its a corrective wave, hence, an X wave in this case. X waves are named "suckers rally" for a reason. The price action we had from the retracement looks like an impulsive wave. This will indicate how we will finish this larger Wave 2. According to how sideways double combos end in this specific pattern set up, we are looking for a zigzag to finish. The B wave should be a 3 wave move to mirror the size and structure of the A wave impulse in the Y wave we are forming. I will be looking around $2.60 ish - $2.80 ish for wave B to finish. Plan to sell some XRP around there. Let's see how it plays out.
GOD BLESS AND TRADE ON
XRPBEARUSD trade ideas

XRP TO THE MOOON !#XRP made a perfect elliot wave pattern i think that it can easily touch 6 $ as its the roof of the rising channel

$XRP Head & Shoulders TopCRYPTOCAP:XRP potentially forming a Head & Shoulders pattern. Pattern is a top signal with a bearish outcome...

XRP/USD – 30-Min Long Trade Setup !📌 🚀
🔹 Asset: XRP/USD (Ripple)
🔹 Timeframe: 30-Min Chart
🔹 Setup Type: Bullish Reversal Trade
📌 Trade Plan (Long Position)
✅ Entry Zone: Above $2.42 (Support Bounce Confirmation)
✅ Stop-Loss (SL): Below $2.31 (Invalidation Level)
🎯 Take Profit Targets:
📌 TP1: $2.52 (First Resistance Level)
📌 TP2: $2.70 (Extended Bullish Move)
📊 Risk-Reward Ratio Calculation
📉 Risk (SL Distance): $2.42 - $2.31 = $0.11 risk per unit
📈 Reward to TP1: $2.52 - $2.42 = $0.10 (1:1 R/R)
📈 Reward to TP2: $2.70 - $2.42 = $0.28 (1:2.5 R/R)
🔍 Technical Analysis & Strategy
📌 Descending Wedge Breakout: Price has broken out of a downtrend, signaling a potential reversal.
📌 Support Rejection: The price tested $2.42 support and showed buying pressure.
📌 Volume Confirmation Needed: Ensure high buying volume when price holds above $2.42 to confirm bullish momentum.
📌 Momentum Shift Expected: If price remains above $2.42, it could push toward $2.52, and further to $2.70.
📊 Key Support & Resistance Levels
🟢 $2.31 – Stop-Loss / Support Level
🟡 $2.42 – Reversal Level / Long Entry
🔴 $2.52 – First Resistance / TP1
🔴 $2.70 – Final Target / TP2
📉 Trade Execution & Risk Management
📊 Volume Confirmation: Ensure high buying volume above $2.42 before entering.
📉 Trailing Stop Strategy: Move SL to entry ($2.42) after TP1 ($2.52) is hit.
💰 Partial Profit Booking Strategy:
✔ Take 50% profits at $2.52, let the rest run toward $2.70.
✔ Adjust Stop-Loss to Break-even ($2.42) after TP1 is reached.
⚠️ Fake Breakout Risk
❌ If the price fails to hold above $2.42 and drops back, exit early to avoid losses.
❌ Wait for a strong bullish candle close above $2.42 before entering aggressively.
🚀 Final Thoughts
✔ Bullish Setup – Bouncing from support at $2.42 suggests a potential reversal.
✔ Momentum Shift Possible – Watch for volume confirmation.
✔ Favorable Risk-Reward Ratio – 1:1 to TP1, 1:2.5 to TP2.
💡 Stick to the plan, manage risk, and trade smart! 🚀📈
🔗 #CryptoTrading #XRP #LongTrade #TechnicalAnalysis #MomentumCrypto #ProfittoPath #TradingView #CryptoMarket #SwingTrading #RiskManagement #ChartAnalysis 📈🔥

XRP “The longer the base, the higher the space”Last time I did this same process(I am not saying is the "right" process) It worked extending to the height of the estimated base in pixels(to have tangible idea of length). If the same repeats, and utility is the perfect fuel, fasten your seatbelts. How far are we from a $240K XRP and a $2M BTC?

$XRP: Ripple’s Rocket – Ready to Soar or Facing Turbulence?(1/9)
Good evening, everyone! 🌙 CRYPTOCAP:XRP : Ripple’s Rocket – Ready to Soar or Facing Turbulence?
CRYPTOCAP:XRP ’s up 8.4% despite a crypto crash, with SEC rumors fueling hope—but will adoption or regulation steer this rocket? Let’s dive in! 🔍
(2/9) – PRICE PERFORMANCE 📊
• Recent Trend: Gained 8.4% despite a crypto market down 20.57% in Feb, per U.Today 📈
• 2025 Context: Speculation of SEC appeal dismissal boosts sentiment 📏
• Sector Trend: Crypto market down, but CRYPTOCAP:XRP bucks the trend 🌟
It’s a fighter, shaking off the bears! ⚙️
(3/9) – MARKET POSITION 📈
• Ranking: Remains a top 10 cryptocurrency, per CoinMarketCap 🏆
• Use Case: Leading in cross-border payments with RippleNet ⏰
• Trend: Regulatory clarity hopes rise, potentially unlocking more adoption 🎯
Firm, a key player in the altcoin arena! 🚀
(4/9) – KEY DEVELOPMENTS 🔑
• SEC Case: Closed-door meeting Feb 27 fuels dismissal talk, per Ripple CEO’s X post 🔄
• Adoption: RippleNet partnerships expand, with new banks joining for faster payments 🌍
• Market Reaction: Up 8.4% amid market turmoil, showing resilience 📋
Adapting, with legal and adoption catalysts! 💡
(5/9) – RISKS IN FOCUS ⚡
• Regulation: SEC case uncertainty persists, appeal process ongoing 🕳️
• Market Volatility: Crypto market’s unpredictable swings can hit hard ❄️
• Competition: Other blockchain platforms vying for cross-border payment dominance ⚖️
Tough, but risks are part of the game! 🛑
(6/9) – SWOT: STRENGTHS 💪
• Resilience: Up 8.4% when others fall, showing strong investor confidence 🥇
• Utility: RippleNet’s fast cross-border payments attract banks and institutions 📊
• Community: Robust support from holders and Ripple’s strategic partnerships 🔧
Got fuel in the tank! 🏦
(7/9) – SWOT: WEAKNESSES & OPPORTUNITIES ⚖️
• Weaknesses: SEC case not fully resolved, adoption slower than hoped 📉
• Opportunities: Potential ETF approval, expanding CBDC projects, and new partnerships 📈
Can it break free and soar? 🤔
(8/9) – 📢 CRYPTOCAP:XRP ’s up 8.4% despite market crash, SEC buzz grows, your take? 🗳️
• Bullish: $3+ soon, legal win sparks rally 🐂
• Neutral: Steady, risks balance ⚖️
• Bearish: Below $2, regulation stalls 🐻
Chime in below! 👇
(9/9) – FINAL TAKEAWAY 🎯
CRYPTOCAP:XRP ’s resilience amid a market crash shows its mettle 📈, but SEC uncertainty and competition pose challenges 🌿. Volatility’s our friend—dips are DCA gold 💰. Grab ‘em low, climb like pros! Gem or bust? S

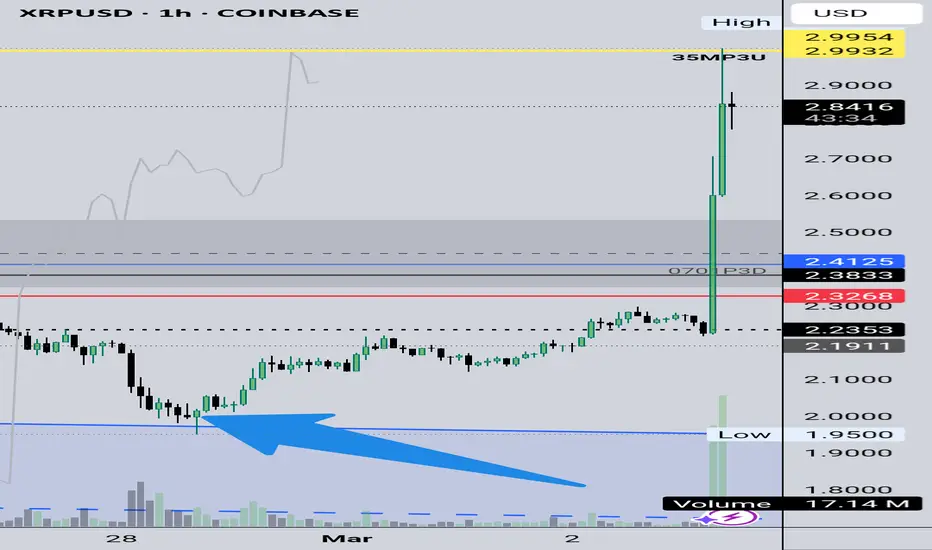
Bruv, what a candle! XRP Trump Pump????A little mention from the Donald absolutely PAMPED Ripple (XRPUSD) yesterday. It ran right into the high of the trend going back 2 bull markets ago and bounced right off.
Where do we go from here? Hard to say, but we barely avoided some amalgamation of a Head-and-Shoulders pattern playing out prior to the Trump (crypto reserve talk) Pump.
200-day moving average creeping up, and price keeps coming in. Will they touch? Tell ME what happens next.

XRP- Dumped To StumpIf you know anyone that missed this pump it's because of timing and placement. It wasn't your Golden Entry- But I have displayed the next move. We are all going to experience a dump but what it's doing is loading up for the buyers as if it was the ark for Noah and the flood is coming. Please buy low and sell high. In the blue I have illustrated every step of the way and where to buy- 6 days - 14 days we will experience a huge draw back before the blast off. Let's chat about this...

xrp weekly looks strong , next target 10 ?big accumulation since 2020 bottom .
near life time strong .
best buy @ 2- 2.5 .
target 10-12

What was XRP on your exchange?Check what your exchange registered for price difference from the top at say $3.033 and if you're exchange was lower, add a buffer of 0.02 cents to the difference or subtract the difference from 0.8465 buy in...
Example, my exchange hit at $2.973
And my chart topped $3.04 - that's a difference of 0.08 cents add 0.02 buffer for a difference of 0.10.
My target is 0.8464 - therefore, adding 0.10 to it, my buy-in is really at 0.9464
Not Financial Advice.
The WizardOfRealms13

XRP ShortThe tools that will be considered as part of the forecast are kept secret.
Pay attention: This is not investment advice.

THE XRP (and crypto) analysis you needed and were looking forDon't let one big green candle confuse you. Is this the takeoff into ATH's? Maybe. Is it worth being wrong? No.
Be patient, identify what "makes sense" for price to do - Meaning: If price came to _____ point, I would put all my eggs in the basket because all the stars (i.e. market dynamics) align.
That's what I've identified here on XRP. But that's just me. If you want to jump on the crypto train NOW then go for it - don't let me stop you. I just look at and study market dynamics and identify what makes sense - and to me, this pump isn't the end all be all of the liquidity build. If anything it's a trap for YOU.
Happy Trading :)
(For further context on everything, watch my previous BTC & XRP videos linked below)

TradeCityPro | XRP: Key Levels After Major Market News👋 Welcome to TradeCity Pro!
In this analysis, I want to review XRP, one of the most significant coins in the market. Yesterday, a major news update was released about XRP, and with a market cap of $156 billion, it currently ranks 3rd on CoinMarketCap.
📰 Important News Update
Before starting the analysis, let’s go over the major news regarding this project. Yesterday, former U.S. President Donald Trump tweeted that he plans to add a crypto reserve to the U.S. Treasury, stating that major cryptocurrencies like BTC, ETH, SOL, ADA, and XRP would be purchased by the U.S. Treasury.
✅ This is extremely bullish news for the market. As we saw yesterday, Bitcoin made a strong, sharp move, and the altcoins listed in the announcement also experienced massive price surges. For example, XRP surged by 30% following the news.
💥 I will discuss Bitcoin and other coins in future analyses, so make sure to check out today’s Bitcoin analysis, where I’ll also cover long-term scenarios.
📅 Weekly Timeframe
On the weekly timeframe, as seen on the chart, after bouncing along the ascending trendline, XRP confirmed its breakout above $0.73056, which initiated the main bullish leg, pushing the price up to $3.06717.
🧩 $3.06717 is the all-time high (ATH) and a major supply zone.If XRP can hold above this level, the next bullish leg could begin.
✨ In the event of a correction, the only key support visible on the weekly timeframe is $1.67220. For further support levels, we need to analyze lower timeframes.
🔍 The RSI oscillator has exited the overbought zone and returned to normal levels.If RSI re-enters overbought conditions, the bullish scenario becomes more likely.
📅 Daily Timeframe
On the daily timeframe, the first key observation is a strong bearish divergence on the RSI, which formed as price moved sideways inside the range between $2.02967 and $3.30467.
⚡️ The trigger for this divergence is a break below $2.02967, which has not yet happened.
Looking at market volume, after the $0.72448 breakout, volume significantly increased. However, volume has been gradually decreasing since the formation of the range.
📊 A drop in volume before a breakout often signals that a breakout is approaching.If volume continues to decline, be prepared for a potential breakout and enter positions accordingly once triggers are confirmed.
📉 If the range breaks downward, and the PRZ at $2.02967 is lost, XRP could enter a deeper correction toward key Fibonacci levels such as 0.382, 0.5, and 0.618.
💫 These three Fibonacci levels are strong support zones, which could prevent a further sell-off.
📈 On the bullish side, if the range breaks to the upside, a new bullish leg will begin, pushing XRP toward higher targets.If this bullish breakout happens, I will update the analysis with potential new targets.
⏳ 4-Hour Timeframe
Let’s now analyze the 4-hour timeframe and identify futures trading triggers.
🔍 After the drop from the $3.36021 peak, the price reached the bottom of the range, and market volume significantly decreased.This signaled that a major move was approaching.
🔑 As seen on the chart, the release of the U.S. Treasury Crypto Reserve news triggered an explosive move, pushing XRP up to $2.95244.
🔽 For futures trading, the closest short trigger is a break below $2.30010.For earlier short entries, we need to wait for a new structure to form.
🛒 For long positions, if $2.95244 is broken, a long entry can be considered.The main resistance for spot buying and the key long position trigger is at $3.36021.
📝 Final Thoughts
This analysis reflects our opinions and is not financial advice.
Share your thoughts in the com

XRP/USD – 30-Min Short Trade Setup!📌 🚀
🔹 Asset: XRP/USD (Ripple)
🔹 Timeframe: 30-Min Chart
🔹 Setup Type: Bearish Breakdown Trade
📌 Trade Plan (Short Position)
✅ Entry Zone: Below $2.90 (Breakdown Confirmation)
✅ Stop-Loss (SL): Above $3.03 (Invalidation Level)
🎯 Take Profit Targets:
📌 TP1: $2.77 (First Support Level)
📌 TP2: $2.60 (Extended Bearish Move)
📊 Risk-Reward Ratio Calculation
📉 Risk (SL Distance): $3.03 - $2.90 = $0.13 risk per unit
📉 Reward to TP1: $2.90 - $2.77 = $0.13 (1:1 R/R)
📉 Reward to TP2: $2.90 - $2.60 = $0.30 (1:2.3 R/R)
🔍 Technical Analysis & Strategy
📌 Bearish Pennant Breakdown: Price has formed a bearish pennant, indicating possible continuation of the downtrend.
📌 Breakdown Confirmation Needed: A move below $2.90 with high volume confirms short entry.
📌 Momentum Shift Expected: If price breaks down, it may move toward $2.77, and further to $2.60.
📌 Volume Confirmation Needed: Ensure high selling volume when price breaks $2.90 for a strong bearish move.
📊 Key Support & Resistance Levels
🔴 $3.03 – Stop-Loss / Resistance Level
🟡 $2.90 – Breakdown Level / Short Entry
🟢 $2.77 – First Support / TP1
🟢 $2.60 – Final Target / TP2
📉 Trade Execution & Risk Management
📊 Volume Confirmation: Ensure high selling volume below $2.90 before entering.
📉 Trailing Stop Strategy: Move SL to entry ($2.90) after TP1 ($2.77) is hit.
💰 Partial Profit Booking Strategy:
✔ Take 50% profits at $2.77, let the rest run toward $2.60.
✔ Adjust Stop-Loss to Break-even ($2.90) after TP1 is reached.
⚠️ Fake Breakdown Risk
❌ If the price fails to hold below $2.90 and bounces back, exit early to avoid losses.
❌ Wait for a strong bearish candle close below $2.90 before entering aggressively.
🚀 Final Thoughts
✔ Bearish Setup – Breaking below $2.90 could lead to lower targets.
✔ Momentum Shift Possible – Watch for volume confirmation.
✔ Favorable Risk-Reward Ratio – 1:1 to TP1, 1:2.3 to TP2.
💡 Stick to the plan, manage risk, and trade smart! 🚀📉
🔗 #CryptoTrading #XRP #ShortTrade #TechnicalAnalysis #MomentumCrypto #ProfittoPath #TradingView #CryptoMarket #SwingTrading #RiskManagement #ChartAnalysis 📉🔥

xrpusd All zones hit! $5 xrp in a week! or less In this chart i explain many targets. I may be off as in immediate timeframe but all targets have been hit period! I believe xrp will hit $5 to $8 in the coming weeks. maybe a month or so. BUY N HOLD!

XRP strategic reserve announcment! UPDATED FORECASTAs indicated in prior post (see: ) we have now reached the near term liquidity target at 2.8-2.9 zone; this news of a strategic reserve is highly likely to be sold off to trap both bulls & bears who are over-leveraged.
They rarely waste a good PR for such price action.
Expecting one more liquidity sweep below 1.70 for a final discount buy opportunity!! Looking to enter with LIMIIT buy orders at 1.65 area; its possible that we extend as low as 1.35 but my mentality is its best not to be idealistic, perfectionistic, or entitled at those levels! The market does not owe you the best or lowest price on anything! For that reason, consider anything below 1.70 to be a huge gift with a big big bow wrapped around it!

We are back on track in the bullish parallel channelJust one week we were below the bullish parallel channel and below the bullish pennant. We are back on track. go go go XRP to the moon. Thanks to Trump who signed an executive order for a national crypto reserve including XRP. SOL and ADA.

xrpusd H4 Best Level to BUY/HOLD +40% gains🔸Hello guys, today let's review 4hour price chart for XRP. Outlook remains bullish currently pullback in progress, however buying low still is a perfect trade setup with low risk.
🔸XRP is currently in pullback/correction mode after the re-test of ATH.
limited upside at current market price 2.50 usd, pullback not complete.
🔸Recommended strategy bulls: BUY/HOLD 2.00 usd, TP 2.80 USD.
40% unleveraged gains. swing trade setup, patience required. good luck.
🎁Please hit the like button and
🎁Leave a comment to support our team!
RISK DISCLAIMER:
Trading Futures , Forex, CFDs and Stocks involves a risk of loss.
Please consider carefully if such trading is appropriate for you.
Past performance is not indicative of future results.
Always limit your leverage and use tight stop loss.

Xrp to the MOON? SeekingPips Long Buying XRPUSD ALL DAY!⭐️ Now today I have tons of messages asking me about XRP ⭐️
❗️Ladies and gentlemen 🟢SeekingPips🟢 has been long bias for the past 4 years at least and especially long XRPUSD All year on this platform with plenty of before the fact TRADE CALLS .🚀🚀🚀
✅️ Now you know I wanted another dip below the shaded area mentioned last week on Saturday 22 February.
(Go Back & See For Yourself)
✅️ We got what we wanted and even a momentary sub $2 XRP
I hope you were filled on your LIMIT ORDERS.
⚠️ My exact words were "Just for the records tho sub $2 I fill my pockets"
❓️NOW WHAT❔️
🌍It's VERY EASY , knowing that over 90% of so called TRADERS LOOSE MONEY in the markets and ALSO that they ENTER THE MARKET IN A RUSH WITHOUT MUCH OF A PLAN but they will sit in a LOOSING POSITION for far TOO LONG and EVEN CLOSE THEIR POSITION as soon as they have a SLIGHT PROFIT.🌍
ℹ️ Your job can be VERY SIMPLE.
With knowing the above all one has to do to CAPITALISE ON THIS INFORMATION is the EXACT OPPOSITE.
⚠️You DON'T HAVE TO BE A GENIUS to make MONEY in the market but you do have to HAVE A PLAN and ACT ON IT RELIGIOUSLY ⚠️
BTFDF - Last Chance To Buy ALTS Before 2025 MOON SZN2017 + macro bull environment
*4 years later*
2021 + macro bull environment
*4 years later*
2025 + macro bull environment
#JustTrustMeBro I been doing this for a long time.

XRP TOO THE MOON The whales will not let institution push any farther and allow the H&S to complete. moon NOW

Buying back a $2.19 xrpBuying back a $2.19 xrp.
Xrp has hit the target on the 4-Hour chart and on the 15-minute chart it has shown that has just reached above the 1.618 and is pulling back to the 50% Fibonacci line.
That would be around the area of $2.17 however I am buying back a $2.19 because different exchanges have an error rate of 1 to 2 cents.
On the 15-minute chart this coincides with the price being below the white ma pulling the white ma down to the green Ma then there will be a small bounce up and then it will pull itself down to below the blue Ma and that is above the white dotted support line.
The price will bounce off that $2.177 area and then it will move upward again this is just a profit grab for some and not for others I intend to capture roughly 10 cents on this move.
The white ma because the prices under it will pull down to the green and then to the blue and not the red this is not Financial advice this is just what I'm doing I'm showing you the one hour chart because that is where the green and the blue conversion the price will Spike down to that level.
Once it hits that level I will be long again.
The WizardOfRealms13

XRP/USD Short Trade Setup Analysis (9H Timeframe - Bitstamp)🔹 Current Setup:
📈 XRP experienced a strong move down from our previous entry at 2.84. Currently XRP has broken through and entered the middle parallel channels whilst respecting and testing their boundaries, verifying the channels validity as a true trading range thus far. At this moment we can see that XRP has broken down to the middle channel, breaking through the median/equilibrium line before now returning up to test the middle channels resistance level.
🔹Price appears to be respecting the level so far ($2.25), with early signs showing a potential break down from this level.
📉 Given our previous entry at 2.84 which remains open, we can now enter a new position here, upon touch of the middle channels upper resistance level. We want to use a tight stop loss, and a smaller amount of margin for this one, given that price is between higher timeframe support and resistance levels. We can see that the most recent high, formed via a candle wick sits at 2.361, so our stoploss should be placed just slightly above this level around 2.38 at which point if hit, would invalidate this trade.
🎯 This allows us to target our new level of 1.52, updated from Februarys 1.4 target identified by the -0.272 fib extension, and a monthly dynamic support.🎯
Previous Trade:
Current Outlook:
Risk/Reward = 1:6.6
📍 Key Resistance Levels (Potential Rejection Zones):
- 🎯 $2.25 (Middle channels upper resistance)
- 📍 Key Support Levels:
- ❗ $2.10 (0.23 Fib retracement)
- 🔻 $1.76 (100 Fib retracement)
- 📉 Deeper Target: $1.52 - $1.40 XRP (Projected based on Fibonacci extensions, channel breakdown & monthly dynamic support)
📈 Bullish Scenario (Breakout Play)
- 🟢 Entry: If price breaks above $2.38, our stop will be hit and we should also close our original short from 2.84.
✅ Justification:
- 🔹 If price breaks and holds above $2.38, the bearish structure could be invalidated and price would find itself back within the higher parallel channels range. At this point it would be advised to close all positions and wait for confirmation in direction.
📉 Bearish Scenario (Primary Expectation)
- ❌ Invalidation Level: Above $2.38
- 🔻 Downside Targets:
- $2.10: 0.236 Fibonacci retracement
- $1.76: 100 Fibonacci retracement
- $1.52: Monthly dynamic support
- $1.36 - $1.40 XRP: Final bearish target (0.272 Fib extension & channel bottom)
✅ Justification:
- ❗ Price remains within a descending channel, signaling a continuation of the downtrend.
- ❗ The ETF-driven pump appears to be a liquidity grab, leading to a likely reversal.
- ❗ A rejection from $2.35 / the middle channels upper resistance, it would confirm bearish continuation, targeting the lower support zones.
- ❗ Bitcoin still needs to come lower to test support, therefore, XRP is likely to fall further due to Bitcoins directing the broader market.
⚡ Key Takeaways:
- 🔹 XRP is facing parallel channel resistance at $2.25, a likely rejection zone.
- 🔹 A breakdown below $2.00 increases bearish pressure, targeting $1.52 XRP.
- 🔹 Bearish bias remains unless price breaks & holds above $3.21.
- 🔹 Expect price to follow the descending channel structure toward $1.52 - $1.40.
