XRP will start to outperform BTC in coming weeks.XRP will start to outperform BTC in coming weeks.
We have a golden cross on weekly timeframe and is reaching big support around 2000 sats also we had a nice reset on rsi levels between January and now.
On the montly timeframe we had nearly 6 months of consolidation. The next move will be a super explosive possibly a new all time high between xrp/btc.
XRPBTC trade ideas

Skeptic | XRP Analysis: Can It Hit $6 After Bitcoin’s $111k?Hey everyone, Skeptic here! Bitcoin just smashed through the $107K resistance, shaking up the whole crypto scene! Is XRP ready to rocket to $6 ? Curious about spot and futures triggers? Stick with me to the end of this analysis for the full breakdown. 😊 Let’s dive in with the Daily Timeframe. 📊
Daily Timeframe: The Big Picture
After an epic 500% rally , XRP has entered a consolidation phase, which we can spot from the decreasing volume. It’s too early to call this a distribution or re-accumulation, but I’m leaning toward re-accumulation for a few reasons:
Bitcoin’s Uptrend: The ongoing bullish trend in Bitcoin is fueling crypto market liquidity.
Positive XRP News:
Ripple and the U.S. SEC reached a settlement in early May 2025, ending a long legal battle over XRP’s status as a security. Ripple paid a $50 million fine, with $75 million of a $125 million escrow returned. This cleared major regulatory uncertainty, boosting investor confidence and paving the way for broader U.S. adoption.
XRP Spot ETF Speculation: BlackRock reportedly discussed an XRP ETF application with the SEC, and firms like Franklin Templeton and Bitwise have filed for XRP ETFs. With the SEC’s new crypto-friendly leadership, the odds of ETF approval are 80-85% by the end of 2025, potentially unlocking massive institutional capital.
Spot Trigger:
The main trigger is a break and consolidation above 3.3684 , which aligns with breaking the daily consolidation box.
This could kick off a new momentum wave. Expect a sharp breakout, so don’t miss it!
If you’re aiming for a long-term buy, I’ll share lower timeframe triggers to front-run this breakout.
First Target :
After breaking the box’s ceiling, aim for 6.64 . I cloned the box and placed it above, as this often works for target setting. 🙂
Tip: Pay close attention to Bitcoin and USDT.D for better target spotting.
4-Hour Timeframe: Long & Short Setups
On the 4-hour chart, price action is getting tighter and tighter, which is awesome. Why? The longer we range, the more liquidity builds up, setting us up for a sharp move with smaller stop losses compared to trending markets. Here’s the breakdown:
Market Context:
The 4-hour timeframe shows stronger bearish momentum, but remember: the major trend is uptrend, and the secondary trend is consolidation.
For shorts, keep position risk low since we’re in a bullish major trend.
For longs, hold positions longer and, if possible, lock in profits early without closing the entire position.
Long Setup:
Trigger : Open a long after a break above 2.4742 .
Key Notes:
Ensure the break comes with rising volume to avoid a fake breakout.
Reduce profit-taking on this position. Why? Higher levels have more liquidity, leading to sharp moves, making it harder to open new positions.
Short Setup:
Trigger: Open a short after a break below support at 2.2926 .
Advice: Take profits quickly and close the position when you hit your targets.
The current candle looks like it failed to break out and formed a shadow, which could increase the odds of a return to the ceiling and a resistance break.
Front-Running Spot Trigger:
To front-run the daily box breakout, open a position after breaking 2.9789 on the 4-hour timeframe.
XRP/BTC Analysis
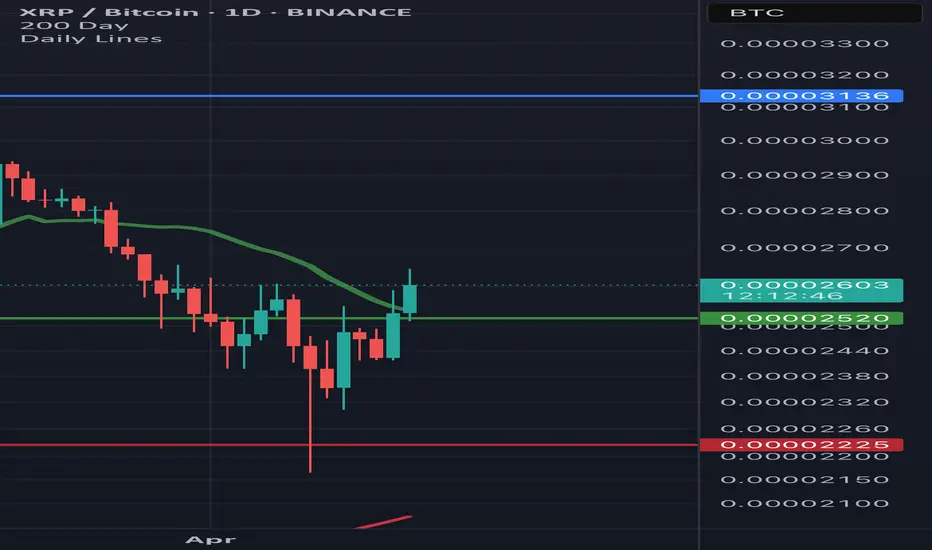
XRP/BTC had a solid rally but is now in a price correction, and it’s a weak correction at that. Here’s what to watch:
Key Level : A break above resistance at 0.00002548 could bring back uptrend momentum to XRP/BTC.
Implication: If this breaks, buying XRP becomes more logical than Bitcoin, as XRP could outperform.
Until Then: Stick with longs on BTC, as liquidity is flowing more into Bitcoin, giving it stronger growth potential.
Pro Tip: Checking the BTC pair is a game-changer—trust me! 😎
💬 Let’s Talk!
If this analysis sparked some ideas, give it a quick boost—it really helps! 😊 Got a pair or setup you want me to dive into next? Drop it in the comments, and I’ll tackle it. Thanks for joining me—see you in the next one. Let's grow together! 🤍

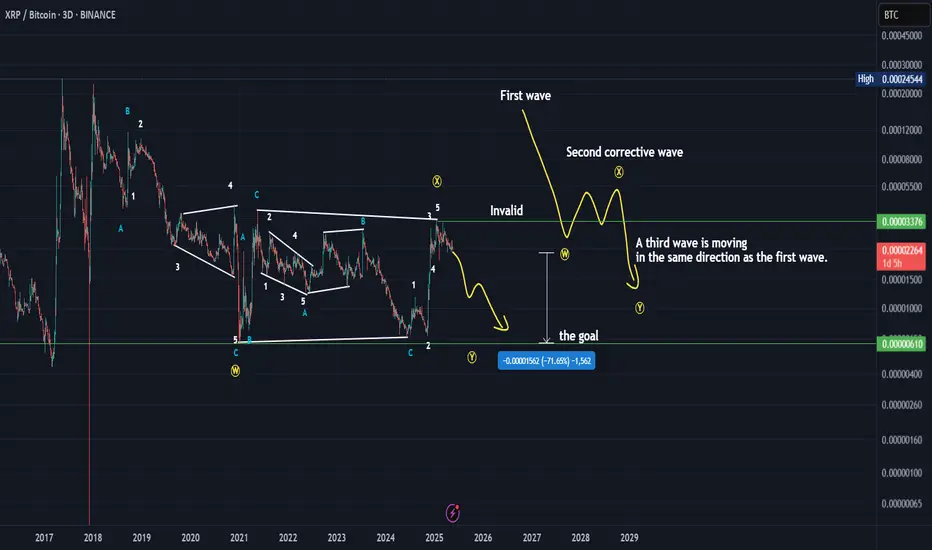
Chart history XRPThis analysis will take a lot of time because it is medium-term and the failure point is close and only when it is broken does the analysis fail. Other than that, it is in a downward trend and all the data is explained on the chart.
*In principle, I am not a supporter of any direction, but I am only giving my point of view, which may be right or wrong. If the analysis helps you, then this is for you. If you do not like this analysis, there is no problem. Just ignore it. My goal is to spread the benefit. I am not one of the founders of the currency.
Xrp will outperform btc in the coming months.Xrp/btc has double bottomed vs BTC for many years. At some point it will show and prove what it has lacked for almost a half decade. I myself am a long term investor who has called Xrp from the major lows and expect it to gain over btc in the next 6 months.

XRP Vs Bitcoin, A New All-Time High In 2025? Must Read!It is very interesting to see the difference between the BTC trading pairs of different big projects, they are all completely different and this can reveal quite a lot. Since the USDT pairs are all the same, lots of useful information can be extracted from the BTC pairs. We can learn a lot by studying these. We can know the real strength of a project, how people are behaving behind the scenes and support (or deny) our bias for future scenarios.
Here XRPBTC is so different compared to ETHBTC or ADABTC which I reviewed recently, three completely different charts.
Let's go straight to the point. XRPBTC is trading for the first time ever above MA200 on a stable basis. It pierced above in July 2023 but only momentarily, conditions now are completely different. It is above MA200 and to stay.
This is how I interpret this signal, XRPBTC is about to shoot up with major force, its biggest bullish wave since 2017 and possibly a new All-Time High. This is the only one, all the other BTC pairs look shaky for a new ATH because Bitcoin is so strong. This one seems to be able to do it easily, based on the chart.
The only way to keep it simple is by stopping now. But there are some long-term higher lows and the pair a good chart. The chart reveals long-term stability and a solid growing base. Something like this, "The project has been developing nicely and building a solid base in the background. This project is about to experience a major move that is likely to be out of proportion with the rest of the market."
This is likely due to new products XRP is launching. Whatever the reason, XRPBTC is to set to grow, long-term. The short-term can be anything this is not the focus here, the conclusion is a strong bullish wave alas 2017.
Namaste.

XRP/BTCWe are now in the driver seat been rejecting all year I’m landing towards this is it due to everything that’s going on in the market
My recent XRP/BTC chartHere is a copy of my XRP/BTC chart that I've talked about recently, with my equilibrium zone.

XRPBTCThe chart shows XRP/BTC on a logarithmic scale, which helps visualize percentage changes over time. XRP/BTC peaked around early 2018, reaching a value close to 0.0003500 BTC per XRP. This aligns with the crypto market's bull run during that period.
After the 2018 peak, XRP/BTC entered a prolonged downtrend, losing 99% of its value relative to Bitcoin by 2025, as noted in the chart's annotation. The price has been making lower highs and lower lows, indicating a strong bearish trend against BTC.
As of March 2025, the price is at 0.00000222 BTC, up 8.73% on the monthly candle, but still near historical lows.

XRPBTC pair no one is paying attention tooXRP is about to make a decent move imo.
Everytime we have tho MA cross it bullish short or long term it’s always a great return after this cross.

XRP/BTC: Will XRP Break Out Against Bitcoin?The XRP/BTC pair is showing intriguing signs of potential as it tests key levels of support and resistance. XRP, known for its focus on cross-border payments and its partnerships with financial institutions, remains a widely discussed asset in the crypto space. While the market sentiment around XRP has been volatile due to legal battles and regulatory uncertainty, its fundamental use case in the financial sector continues to draw attention.
The broader market context is bullish for Bitcoin, but XRP's price action against BTC has shown periods of strength, suggesting that it may be ready to capitalize on any altcoin rotation. Technically, XRP is nearing critical price points that could indicate a breakout or a retracement. Keep an eye on market volume and any potential news regarding Ripple’s ongoing legal case, which could impact future price movements.

XRP-BTCXRP-BTC - potentials
Most Important thing is - Cycles.
I don't show them here, but it's mid June July for XRP max.
Then... it's (probably) Crash - Cycle for that Aug.-Sep.... (sry to say that).
Good Luck!

XRP is just getting started. XRPBTC chart has lots of room left.XRP has made some spectacular moves since the "Trump election pump" began on November 4, 2024, but we haven’t seen anything yet. Bitcoin has been absorbing hundreds of billions of crypto investment dollars during this timeframe, but when money starts fleeing Bitcoin in search of more undervalued assets, XRP will be the prime beneficiary.
Bitcoin is obsolete and is being rejected by countries around the world as a consideration for strategic crypto reserves. ETH is too energy-inefficient and costly to use. XRP is the only viable option. Plus, with RLUSD, the ability to on-ramp or off-ramp has never been easier or more efficient than it is right now.
Get ready!
Good luck, and always use a stop-loss!

Buy dips on XRPBTC ready for another big leg up
big r/r trade that allows for wide stop, great oportunity here


You get this opportunity once in 4 yearsHelloOOoooo
this one of the safest entries for XRP
if you look at XRP/BTC chart you will see this is the most important level since 2014!
last time CRYPTOCAP:XRP bounced from it was in 2020 1400 days ago
also, we have bullish RSI and MACD divergence on weekly timeframe
imo XRP going to pump to 0.5 FIB level which is about 400% from here
good luck!

XRP will increase in BTC valueThe xrp btc charts are telling me that the xrp is not over, i will take most of my profit at the 702 retrsacemnt. XRP price towards dollar will be between 9-11 dollars if btc not increases to mcuh from here.

XRP/BTCCup and handle formation now complete of XRPBTC.
Targeting a 1:1 ration for next leg up. Of BYC holds its current level. We should see decent gains for XRP.

XRP/BTCCup and handle formation with the handle now complete. Target of a 1:1 ratio mid February for the next leg up.

Ripple / BitcoinHere’s my XRP in sats targets. We’re breaking out from an overhead resistance, and we should retest the top of the range, before coming back down to retrace the breakout zone. It doesn’t mean it comes all the way down, but there is a target there, which is land on top of the prior overhead. Good luck. I’m calling $30, sell $28 on this initial pump

XRPBTC This is how you can play XRP's strength.The XRPBTC pair is rising parabolically since November as XRP has been massively outperforming Bitcoin.
This 1week chart shows the pair's price action since August 2013 and that is somewhat a Rectangle.
Even though the price has only crossed the 0.5 Fibonacci level twice in 5 years before this week, it appears that the double bottom formation can alter that and with incredibly strong fundamentals for XRP, bring it back to the glory days before 2017.
A sound trading plan would be to keep buying XRP until the pair reaches the 0.786 Fibonacci level, where historically it has been a good level to sell and switch to BTC.
Four times BTC regain its strength and outperformed XRP there.
Even though it can go higher, it is worth the risk selling XRP and buying BTC on the 0.786 Fib, all the way to at least the 0.382 Fib if not 0.236.
In times of clear trends, paying attention to this pairs can be enormously profitable.
Follow us, like the idea and leave a comment below!!

XRP/BTC pump followed by 200 day cool off, then pump again
Been here for a while (2016) and got out at $3.25 in 2017, rebought at .30 in 2022. Basic TA with a bull pennant shows the flagpole getting really close to my first target level on xrp/btc. There is potential to hit the higher level as well where my solid bright red line is around .000246btc/xrp
likely we see the dotted line at .000123btc/xrp
2017 repeat seems highly probable
lmk your thoughts

Bullish XRP - XRP/BTC Chart - Weekly Time FrameXRP/BTC has broken out vs Bitcoin on the Weekly chart. This seems to be true no matter how you draw the lines too. The red line in the image in particular had several attempts made before finally breaking. So it was a strong resistance level. XRP broke out and re-tested the level perfectly. A bullish move upwards for XRP should continue in the coming weeks or months.
What this means is that XRP will be a better investment than BTC. XRP will make up some ground compared to BTC in terms of market cap.
Note: This agrees with my monthly analysis for XRP/BTC also. See link to related publication. Both are on high time frame charts which makes them more reliable, but they may take a long time to fulfill.
