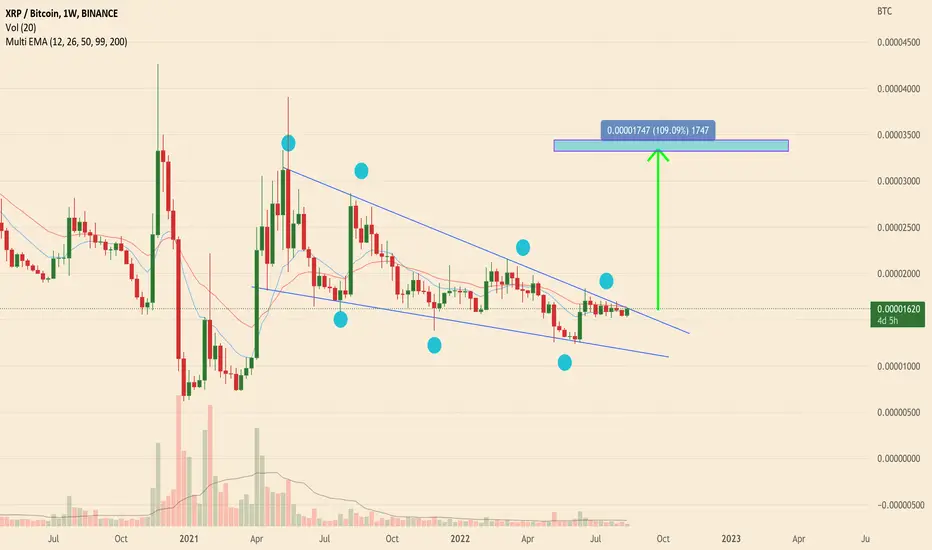
XRP is about to explode! A huge falling wedge on D1 will be broken out soon.
Move the coins off the exchanges if you already didn't and buckle up!
It will be a crazy ride, good luck!
XRPBTC trade ideas

XRP - What Dead Coins Look LikeSo many XRP fanboys still around hoping XRP can relive former glories...
But look back at those big bullish candles.
Really it was all over at the start of 2018.
And since the top of the last bullish candle of September 2019, all its done is dribble down and down 87% against BTC.
More to come I would imagine.
Hope is not a trading strategy.
Not advice.

XRP MOMENTUM IS BUILDING READY FOR VOLATILITYXRP is long overdue a significant move against BTC. Expecting the 50 EMA to be tested in the next few days

Is XRP preparing for the blast-off?As we can see the similarity in the past, it can also be one of the case in the future. Once when it breaks out it is going straight up and we'll see the melting faces again.

$XRP - even this should resurrect
thought i'd see what the ripple army is up to , hang in there lad's now is not the time to sell.
flip 2811 sat's expect a big green dildo like the one's on the far left ..
alert set will ape in once it does for now its got to reclaim the 200 on the D1 and grind on up.

MAYBE RIPPLE THIS TIME?Ripple/ BTC pair is not pumping for a long time. Ripple likes to make suprise :) Maybe this time?

XRPBTC Moving Average AnalysisPrice moons on XRPBTC cause sharp turns in each moving average
First moon caused 50MA a U turn
Second 100MA U turn
Now we are approaching the 200MA's turn
The red horizontal dotted line and box in red shows a point where all moving averages were in the state that they will soon be in when XRPBTC makes its moving average U turn
Right now on the MACD we are higher than this horizontal point, suggesting that price on this chart will increase from here
The time period between the first 50 and 100MA moon points was about 2.5 years, right now we have experienced a long bear phase from XRP currently being in 2022 waiting for the 200MA

XRP vs BTC - Massive Upside Potential on the BreakoutXRPBTC is testing a long-term resistance trend going back to its January 2018 high. Getting past resistance here would most likely lead to a very high volume breakout. Its daily RSI is currently at 70 which is very bullish territory. As long as BTC can find support here, we should see fireworks. Failure to breakout might mean XRP will revisit the bottom of the blue falling wedge before retesting resistance again. I'm buying the breakout.


Xrp poised for massive breakout Looking at the pairing between XRP and Bitcoin we can see this is close to getting launched XRP has been suppressed for too long.

xrpbtc LongIt seems that XRP is breaking out of the falling wedge! Lets see if that plays out! Also, I have a feeling we will receive some good news regarding the Sec trial, very soon! GL everyone!

XRP - very complexe inverse H & S pattern against bitcoinAs many altcoins, XRP has started to show strength against bitcoin !!
Over the years it has built a very complex inverse Head & Shoulders pattern.
There is a very heavy bulk of resistance at the hight of the neckline !
Once this breaks price could rise dramatically......
Will be interesting to see how this further develops ....


XRP/BTC Support and Resistance MonthlyIf it falls below support watch out. XRP could go up against BTC.


XRP - odds in favour of bulls?Looking at the whipsaw on this cross, I expect a strong breakout.
The second question - why should it happen?
May be, because of BTC that should go to $25k? :))
Please also look at the idea linked below.
Trade safe

XRPBTC: How is it going to play out?This chart shows we are in an accumulation phase which may last until 2025 then we may see a breakout and retest before we shoot up to the 2017 highs.
If you understand, good for you.

$XRP at the best buying opportunity! This is the best buying dollar cost averaging into XRP since 2016.
XRP price is sitting on the grey area which is the FIB bottom. We have been here for quite awhile and this chart has only been able to pick it up with the data we have. Currently following 2015-2017, which it is currently extended now.
To find the top we use the yellow line which indictates market tops time to sell, When price of XRP is above the yellow line you start dollar cost average out of the position.
The yellow line is currently 18X from current prices however that line will keep moving up when we are closer to the bottom.


XRP/BTC Fractal Hold BoyI hope to see last weeks of punishment and pain, the best thing is to accumulate and wait for a wonderful end of the year.
Buy zone = 1000Sats-1150sats

Just an interesting chart The XRP to BTC ratio looks like a possible ABC correction is playing out which should lead to a 5 wave impulse.

XRP Flips Solana, Becomes 6th Biggest CryptoIn an interesting turn of events, XRP (XRP) has flipped Solana (SOL). XRP is now the sixth biggest cryptocurrency in the world by market cap.
At the time of writing, with a market cap of $25,935,499,965, XRP is at $0.536664, 0.2% up in the past hour. Meanwhile, Solana has a current market cap of $24,166,338,404.
Analysts on Twitter also claim that XRP has its daily closing with a bullish divergence. However, not everyone agrees with this; some state that they have been waiting for the XRP relief for years but were left disappointed.
