XRP - WHAT HEAD AND SHOULDERS?XRP has gained a lot of attention by influencers who claim the chart forms a head and shoulders top.
logic tells me to do the opposite of any influencer or news headline.
what's a more optimistic pattern than the dreaded head and shoulders? perhaps a bullish consolidation wedge? XRP's chart is full of bullish flags and symmetrical triangles. if one focuses on not just a pattern, but a common pattern (very meta indeed), there seem to be common points where rays can be projected.
it just so happens those rays in my opinion show me the consolidation range, breakout point, and retracement level before confirmation and continuation.
anyone else see what i see?
XRPBULLUSD trade ideas

I now believe this is the beginning of the Bull RunI now believe this is the beginning of the Bull Run.
This will be the final attempt to shake everyone out before it goes up I say this because I have a DOT on the bottom of one of my price bars on the 4-Hour chart which indicates this is going up.
What you now see here is $1,009 per every line on 3x to the upside so I'm buying in on xrp 3L $1,009 per line as it drops in price I'll add the money and if it hits the very bottom line I will max out I do believe this is going up from here!

XRP BEFORE & AFTER@XRP Weekly-Monthly Analysis / Retracement...Weekly - Monthly trend: Bearish
Chart Pattern: Head & Shoulders (H&S) - Bearish Continuation Pattern
Bearish Candlesticks signals:
HANGING MAN (Bearish, Single Candlestick pattern) / Weekly Timeframe / 09 DEC 2024
BEARISH ENGULFING (Bearish, Double Candlestick pattern)/ weekly Timeframe / 27 JAN 2025
TWEEZER TOP (Bearish, Double Candlestick pattern) / 1 Day timeframe / 20 FEB 2025
FALLING THREE METHODS (Bearish, five-fold Candlestick pattern) / 1 Day timeframe / 07 MAR 2025
Retracement Fib Price Levels:
0.00% (3.4000)
23.60% (2.6879)
38.20% (2.2474)
50.00% (1.8914)
61.80% (1.5353)
78.60% (1.0284)
100.00% (0.3827)
Good prices for buy (the lower the better):
61.80% (1.5353) – Golden Zone / Golden Pocket
78.60% (1.0284) – Entry Zone
Between 78.60% (1.0284) and 100.00% (0.3827) is the Risk Zone, which we have the Neckline of the ‘’ Quadruple Bottom Pattern ‘’ at the price range ‘’ 0.6291 – 0.7850 ‘’
I am having buy limit at 0.78500 on the neckline of ‘’ Quadruple Bottom Pattern ‘’.

XRP is now testing a major support#XRP price is testing the bottom of the ascending channel it has been moving after november pump. Formed bearish head and shoulders and also ascending channel breakdown results bearish. So, this spot is very very important for #ripple 's price decision. If CRYPTOCAP:XRP breaks down this support, then it may aim the retest zone at ~1.20 usd. A strong bounce is the temporary invalidation. Not financial advice.

I just fully bought into a short position on xrpI just fully bought into a short position on xrp.
As I fully expect xrp to drop by tomorrow I am in a short position currently.
All of my indicators are pointing down

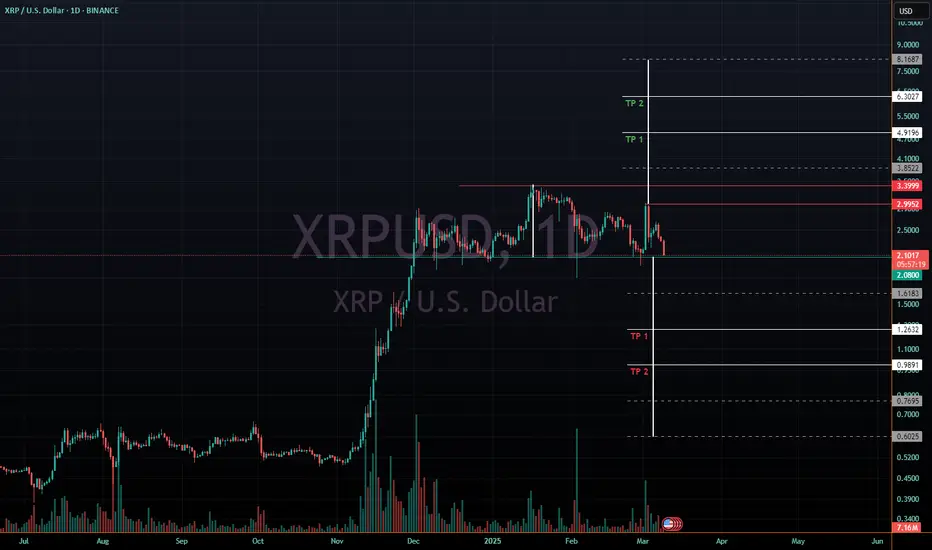
Head Shoulders Bull and Bear TargetsLose $2.08 - Ripple will move down to 1.26 and then 98 cents approx
Hold 2.08 and reclaim ~3 dollars - Ripple can move up to 4.91 and then 6.3
Dashed lines are additional possible targets if it continues in either direction, the first dashed lines also mark halfway points to bull or bear TP 1

XRP still bullish > 2 scenarios, one target > 20 USDEither way, we are going to re test resistance at 2.92 ish to ATH.
1/ Blue path > Breaking it > we skyrocket to 20 USD
2/ Purple path> Another rejection will mean a very possible crash sub 1.50 level before we re ignite it to new ATH.
I'm betting on the last scenario as we usually see a swift crash/correction before impulse, and we've barely corrected.
As for the timing, be patient. We might be sitting in price discovery until at least mid july.
Good luck all!

XRP Weekly-Monthly Analysis / Retracement Levels for BuyWeekly - Monthly trend: Bearish
Chart Pattern: Head & Shoulders (H&S) - Bearish Continuation Pattern
Bearish Candlesticks signals:
HANGING MAN (Bearish, Single Candlestick pattern) / Weekly Timeframe / 09 DEC 2024
BEARISH ENGULFING (Bearish, Double Candlestick pattern)/ weekly Timeframe / 27 JAN 2025
TWEEZER TOP (Bearish, Double Candlestick pattern) / 1 Day timeframe / 20 FEB 2025
FALLING THREE METHODS (Bearish, five-fold Candlestick pattern) / 1 Day timeframe / 07 MAR 2025
Retracement Fib Price Levels:
0.00% (3.4000)
23.60% (2.6879)
38.20% (2.2474)
50.00% (1.8914)
61.80% (1.5353)
78.60% (1.0284)
100.00% (0.3827)
Good prices for buy (the lower the better):
61.80% (1.5353) – Golden Zone / Golden Pocket
78.60% (1.0284) – Entry Zone
Between 78.60% (1.0284) and 100.00% (0.3827) is the Risk Zone, which we have the Neckline of the ‘’ Quadruple Bottom Pattern ‘’ at the price range ‘’ 0.6291 – 0.7850 ‘’
I am having buy limit at 0.78500 on the neckline of ‘’ Quadruple Bottom Pattern ‘’.

XRPUSD - Alternate CountingTrend:
Major Trend : Bullish
Minor Trend : Retracement
Note:
Here is my alternate EW counting for XRPUSD. If the ATH is considered Wave (III), then the current price movement looks like a triangle to form Wave (IV) in 5 abcde waves. Let's see whether the price is fluctuating in that triangle or not.
This is just my point of view. No trade recommendation. Please do your own analysis before placing any trade. TAYOR.

XRP and the market will fall, for nowbeen waiting a minute for the pull back, very excited. These recent endorsements by trump are a perfect opportunity for the big guys to sell into.
Could be a great trade in the middle once xrp hits $1.00, looks like it could pop up to $1.70 before falling finally to $0.80
Bitcoin could fall anywhere from $67,000 to even $50,000 before we make our next leg up.
I see XRP in the mid $20.00s before the end of the year.
Trade responsibly friends

Ripple XRP Price Levels Still BULLISH? XRPUSD Buy Long for SP!🌍Just a quick update from 🟢SeekingPips🟢
ℹ️ Note the CLEAN and VERY CLEAR reactions at KEY PRICE LEVELS that SeekingPips identified as EARLY as 21st January 2025
(Please go back amd see the XRP chart shares from that day)
⭐️ By now you know well that I always prefer TIME over PRICE however, we can not utilise one without the other so identifying KEY PRICE LEVELS where we can expect key reactions and potential ENTRY & EXIT signals is KEY TOO.👍
✅️ Again PREPARATION is KEY.
✅️ Have a plan and stick to it like GLUE.
🟢SEEKINGPIPS🟢 opinion remains the same.
🌎BUY the DIPS and DCA then we sit WATCH and ENJOY the ride.

XRPCould go ether way. Just gotta monitor.
Beware, use cautions. Going into Sydney time territory. Safe trading. Use risk management, stop losses, take profits

XRP/USD "Ripple vs US Dollar" Crypto Market Heist Plan🌟Hi! Hola! Ola! Bonjour! Hallo!🌟
Dear Money Makers & Robbers, 🤑💰🐱👤
Based on 🔥Thief Trading style technical and fundamental analysis🔥, here is our master plan to heist the XRP/USD "Ripple vs US Dollar" Crypto market. Please adhere to the strategy I've outlined in the chart, which emphasizes long entry and short entry. 🏆💸Be wealthy and safe trade.💪🏆🎉
Entry 📈 :
"The loot's within reach! Wait for the breakout, then grab your share - whether you're a Bullish thief or a Bearish bandit!"
Buy entry above 3.0000
Sell Entry below 2.2000
However, I recommended to place buy stop for bullish side and sell stop for bearish side.
Stop Loss 🛑:
Thief SL placed at 2.7000 (swing Trade Basis) for Bullish Trade
Thief SL placed at 2.5000 (swing Trade Basis) for Bearish Trade
Using the 4H period, the recent / nearest low or high level.
SL is based on your risk of the trade, lot size and how many multiple orders you have to take.
Target 🎯:
-Bullish Robbers TP 4.1000 (or) Escape Before the Target
-Bearish Robbers TP 5.0000 (or) Escape Before the Target
📰🗞️Fundamental, Macro, COT, Sentimental Outlook:
XRP/USD "Ripple vs US Dollar" Crypto market is currently experiencing a Neutral trend (there is a higher chance for Bullishness)., driven by several key factors.
🔶Fundamental Analysis
Ripple Adoption: Growing adoption of Ripple's payment technology, with increasing partnerships with major financial institutions
XRP Supply: The total supply of XRP is capped at 100 billion, which could lead to increased demand and higher prices
Regulatory Environment: The regulatory environment for XRP is still uncertain, which could impact its price
🔷Macro Economics
Global Economic Trends: The ongoing global economic recovery is expected to drive up demand for cryptocurrencies, including XRP
Inflation Rate: Global inflation is expected to rise to 3.8% in 2025, potentially increasing demand for cryptocurrencies as a hedge against inflation
Interest Rates: Central banks are expected to maintain low interest rates in 2025, supporting cryptocurrency markets
🔶COT Data
Net Long Positions: Institutional traders have increased their net long positions in XRP to 60%
COT Ratio: The COT ratio has risen to 2.5, indicating a bullish trend
Open Interest: Open interest in XRP futures has increased by 20% over the past month, indicating growing investor interest
🔷Sentimental Outlook
Institutional Sentiment: 65% bullish, 35% bearish
Retail Sentiment: 60% bullish, 40% bearish
Market Mood: The overall market mood is bullish, with a sentiment score of +40.
🔶Technical Analysis
Moving Averages: 50-period SMA: 2.5000, 200-period SMA: 2.2000.
Relative Strength Index (RSI): 4-hour chart: 68.21, daily chart: 64.14.
Bollinger Bands: 4-hour chart: 2.8000 (upper band), 2.5000 (lower band).
🔷Market Overview
Current Price: 2.7500
Daily Change: 4.2%
Weekly Change: 18.1%
🔶Overall Outlook
The overall outlook for XRP/USD is bullish, driven by a combination of fundamental, technical, and sentimental factors. The expected increase in Ripple adoption, growing demand for XRP, and bullish market sentiment are all supporting the bullish trend. However, investors should remain cautious of potential downside risks, including changes in global economic trends and unexpected regulatory developments.
⚠️Trading Alert : News Releases and Position Management 📰 🗞️ 🚫🚏
As a reminder, news releases can have a significant impact on market prices and volatility. To minimize potential losses and protect your running positions,
we recommend the following:
Avoid taking new trades during news releases
Use trailing stop-loss orders to protect your running positions and lock in profits
📌Please note that this is a general analysis and not personalized investment advice. It's essential to consider your own risk tolerance and market analysis before making any investment decisions.
📌Keep in mind that these factors can change rapidly, and it's essential to stay up-to-date with market developments and adjust your analysis accordingly.
💖Supporting our robbery plan will enable us to effortlessly make and steal money 💰💵 Tell your friends, Colleagues and family to follow, like, and share. Boost the strength of our robbery team. Every day in this market make money with ease by using the Thief Trading Style.🏆💪🤝❤️🎉🚀
I'll see you soon with another heist plan, so stay tuned 🤑🐱👤🤗🤩


AND THESE LITTLE PIGGIES CRIED WAAH WAAH ALL THE WAY HOMEIf you haven't realized yet or maybe you all cant read properly but your hopes of getting into the crypto reserve are long gone. Not only that but they intend to sell the forfeited and seized digital assets other than Bitcoin to buy more Bitcoin. REJECTED!

XRP/USD – 30-Min Long Trade Setup!📌 🚀📈
🔹 Asset: XRP/USD (Ripple / U.S. Dollar)
🔹 Timeframe: 30-Min Chart
🔹 Setup Type: Bullish Breakout Trade
📌 Trade Plan (Long Position)
✅ Entry Zone: Above 2.53200 (Breakout Confirmation)
✅ Stop-Loss (SL): Below 2.44965 (Invalidation Level)
🎯 Take Profit Targets:
📌 TP1: 2.64795 (First Resistance Level)
📌 TP2: 2.79059 (Extended Bullish Move)
📊 Risk-Reward Ratio Calculation
📉 Risk (SL Distance): 2.53200 - 2.44965 = 0.08235 risk per unit
📈 Reward to TP1: 2.64795 - 2.53200 = 0.11595 (1:1.41 R/R)
📈 Reward to TP2: 2.79059 - 2.53200 = 0.25859 (1:3.14 R/R)
🔍 Technical Analysis & Strategy
📌 Bullish Breakout Formation: Price is breaking out from a symmetrical triangle, confirming strength.
📌 Support Confirmation: Strong support at 2.44965, acting as a demand zone.
📌 Volume Confirmation Needed: Ensure strong buying volume above 2.53200 for momentum.
📌 Momentum Shift Expected: Staying above 2.53200 could push price to 2.64795 and further to 2.79059.
📊 Key Resistance & Support Levels
🟢 2.79059 – Final Target / TP2
🔴 2.64795 – First Resistance / TP1
🟡 2.53200 – Breakout Level / Long Entry
⚪ 2.44965 – Stop-Loss / Support Level
📉 Trade Execution & Risk Management
📊 Volume Confirmation: Look for strong bullish volume above 2.53200 before entering.
📉 Trailing Stop Strategy: Move SL to entry (2.53200) after TP1 (2.64795) is hit.
💰 Partial Profit Booking Strategy:
✔ Take 50% profits at 2.64795, let the rest run toward 2.79059.
✔ Adjust Stop-Loss to Break-even (2.53200) after TP1 is hit.
⚠️ Fake Breakout Risk
❌ If price drops below 2.53200 after breakout, exit early to limit losses.
❌ Wait for strong bullish candle close before entering aggressively.
🚀 Final Thoughts
✔ Bullish Setup – Breakout above 2.53200 signals upside potential.
✔ Momentum Shift Possible – Watch for volume confirmation.
✔ Risk-Reward Ratio – Favorable 1:3.14 R/R to TP2.
💡 Stick to the plan, manage risk, and trade smart! 📈🔥
🔗 Hashtags for Reach & Engagement:
#XRP 🚀 #CryptoTrading 📈 #XRPUSD 📊 #TradingNews 📰 #MarketUpdate 🔥 #Investing 💰 #LongTrade 🏆 #Crypto 📉 #ProfittoPath 🏆 #SwingTrading 🔄 #DayTrading ⚡ #TechnicalAnalysis 📉 #CryptoSignals 📊 #FinancialFreedom 💡 #MarketTrends 📊 #CryptoAlerts 🔔 #TradeSmart 🤓 #Bullish 📈 #RiskManagement ⚠️ #TradingCommunity 🤝 #SmartTrading 💰 #MarketAnalysis 📊 #TrendBreakout 🚀

Entertainment Purposes Only - XRP destiny analysis based on BaZi(For Entertainment Purposes Only – Not Investment Advice. Please Conduct Your Own Research Before Making Any Decisions.)
This is purely for entertainment purposes—Using Deepseek, we generate a BaZi chart based on XRP's birth date and conduct a destiny analysis to predict its future trajectory :)
The concept and code of XRP were first developed by Jed McCaleb (one of Ripple’s co-founders) in 2011, with its initial technical framework established on April 18, 2011. On June 2, 2012, the XRP Ledger was officially launched, marking the birth of XRP as a cryptocurrency. This analysis is based on June 2, 2012, the official launch date of the XRP Ledger.
Deepseek's Analysis of XRP’s Birth Chart
XRP Birth Details:
Date of Birth: June 2, 2012
Lunar Calendar: April 13, 2012 (Year of the Water Dragon)
BaZi (Four Pillars of Destiny):
Year Pillar: Ren-Chen (壬辰)
Month Pillar: Yi-Si (乙巳)
Day Pillar: Jia-Wu (甲午)
BaZi Interpretation:
Year Pillar: Ren-Chen (壬辰)
BaZi Interpretation
Heavenly Stem: Ren (壬, Water) → Represents wisdom and liquidity.
Earthly Branch: Chen (辰, Earth) → Represents stability and accumulation.
Interpretation: Water is controlled by Earth, indicating XRP may face resistance in its early stages. However, with intelligence and strategy, these challenges can be overcome.
Month Pillar: Yi-Si (乙巳)
Heavenly Stem: Yi (乙, Wood) → Represents growth and development.
Earthly Branch: Si (巳, Fire) → Represents passion and vitality.
Interpretation: Wood feeds Fire, meaning XRP has strong innovation potential and market energy.
Day Pillar: Jia-Wu (甲午)
Heavenly Stem: Jia (甲, Wood) → Represents leadership and initiative.
Earthly Branch: Wu (午, Fire) → Represents enthusiasm and action.
Interpretation: Wood fuels Fire, suggesting XRP has strong leadership and execution power, enabling it to establish a solid market position.
Destiny analysis to predict its future trajectory for 2025 and 2026
2025 Outlook – Ding-Wei (丁未) Cycle
Prediction: XRP may enter a relatively stable growth phase in 2025, focusing on internal accumulation and resource integration. The emphasis this year may be on long-term planning and strategic adjustments rather than aggressive market expansion.
2026 Outlook – Bing-Wu (丙午) Cycle
Prediction: XRP could enter a more dynamic and aggressive growth phase in 2026, characterized by innovation and transformation. This year may see greater market competitiveness and influence for XRP.
-------------------
My Personal View
Considering the current environment, for XRP to appreciate steadily in 2025, the first priority is to resolve its legal dispute with the U.S. Securities and Exchange Commission (SEC). This process may take at least until April or May before more accurate information becomes available. After that, the approval of an XRP-related ETF could be the next major milestone, with further clarity possibly emerging in October. Additionally, there is speculation that XRP could be included in Trump’s Crypto Reserve plan, although no concrete details have been confirmed yet.
XRP’s overall performance this year will be influenced by these developments, leading to significant price fluctuations.
Today marks the first White House cryptocurrency conference, which may provide further insights. Resolving these key issues in 2025 is crucial for XRP to achieve sustainable growth. If they are successfully addressed, then 2026 could indeed hold great potential.
Let’s wait and see. haha
Leave comments below with your thought, you can try and do this via Chatgpt or Deepseek as well. ask following question “Based on the founding date of XRP on June 2, 2012, and its birth chart, let's share the Ba Zi (Four Pillars of Destiny) for XRP and its major luck cycles for 2025 and 2026.”
Elliot wave completed correction incomingElliot wave completed correction incoming 3rd wave is over correction generally follow before a huge pump.

XRP has been consolidating after a strong rally, but key levels 🚀 XRPUSD: Is the Next Big Move Coming? 📊
XRP has been consolidating after a strong rally, but key levels are forming!
🔹 Current Price: $2.5995 (+3.91%)
🔹 Key Resistance: $3.0029 (Supply Zone)
🔹 Major Support: $1.9580 (Weekly HL)
📉 Bearish Case: If XRP fails to break the supply zone ($3.0029-$3.2038), we could see a rejection leading back to lower support levels.
📈 Bullish Case: A breakout above $3.0029 could trigger another rally, pushing towards $3.20+ in the short term.
💡 Watching for confirmations near the 15min demand zone before entering a trade.
🔎 What’s your bias—Bullish or Bearish? Drop your thoughts below! 👇
#XRP #XRPUSD #CryptoTrading #PriceAction #TechnicalAnalysis #CryptoNews #CryptoSignals #DayTrading #Forex #TradingView

XRPUSD - Smart Money Concept (CHOCH & Supply/Demand)🚀 **XRPUSD – Smart Money Concept (CHOCH & Supply/Demand) 🚀
📊 Timeframe: 4H | 💰 Exchange: Binance**
🔍 Concepts Used: CHOCH (Change of Character), Supply & Demand, Market Structure
📈 Market Analysis:
XRPUSD recently showed a strong bullish reversal after tapping into a 4H Demand Zone, leading to a rally toward the Daily High (D HH) level. The CHOCH (Change of Character) confirms a potential shift in market structure from bearish to bullish.
🔹 Key Levels to Watch:
✅ Demand Zone: $1.9580 - $2.3683 (Strong Buy Zone)
✅ Supply Zone: $2.7299 - $3.0029 (Potential Rejection Area)
✅ Next Resistance: $3.2038 (Higher Timeframe Key Level)
📊 Trade Plan & Strategy:
🔸 If price retraces back to the demand zone, we may see a bullish continuation targeting $2.7299 - $3.0029 supply zone.
🔸 If price enters the supply zone, watch for bearish rejection and potential short setups.
🔸 Confirmation via candlestick patterns (e.g., engulfing, rejections) can strengthen bias.
📉 Market Sentiment:
📈 Bullish above $2.3683, targeting $3.0029
📉 Bearish if price rejects $3.0029 and forms a CHOCH to the downside
⚠️ Disclaimer:
🚨 This is not financial advice. I’m not a financial advisor. Do your own research before making any trading decisions. Trade responsibly! 🚨
📢 What’s Next?
📩 What do you think? Will XRP break $3.20? Comment below! 🚀
🔥 LIKE & FOLLOW for more Smart Money insights & trade setups! 🔥
#XRPUSD #Crypto #SmartMoney #SupplyAndDemand #CHOCH #PriceAction #TradingView #Forex #CryptoTrading #Liquidity #BreakOfStructure #TradingStrategy

inverted hammers during downtrend = BullishMultiple inverted hammers on 4H chart during downtrend means super bullish. So let's go. XRP to the moon !

XRPUSD—Are we ready for Wave 3?Trend:
Major Trend: Bullish
Minor Trend: Bullish
Note:
I believe Wave 2 (Green) is currently completed with a sharp pullback. If not yet completed, then it will form a new complex wave.
Next Wave 3 will have 5 minor waves.
This is only my EW view. No trade recommendation. Please do your own analysis before placing any trade. TAYOR.
