XRP could bottom by end of April reach short-term peak by June(The following is my personal opinion only and does not constitute investment advice. Please exercise your own judgment before making any decisions.)
We can often gauge the development of digital asset cycles by observing broad money supply (M2), as it reflects the amount of excess liquidity in the market. In general, a higher level of "hot money" tends to support new highs in digital assets, while tightening liquidity often signals potential price declines.
As XRP’s market capitalization continues to grow, we can now apply similar macro liquidity-based analysis to predict XRP future trend.
Typically, changes in M2 do not immediately reflect in asset prices — there is usually a lag effect. For Bitcoin, I use a 77-day time offset to analyze cyclical behavior. Since altcoins tend to respond more slowly to liquidity shifts, I use a 108-day lag for XRP.
As shown in the chart, although the market is currently gripped by fear due to tariff-related news, based on the underlying liquidity conditions:
- XRP may see a short-term rebound around April 18, with the current cycle likely to bottom out near April 29. In my opinion, a Great buy zone lies between $1.29 and $1.60.
- The top of the current cycle is expected to appear around June 27 , with the price likely to break previous highs and reach the $3.40 to $3.70 range.
Of course, this does not rule out the possibility of an explosive rally during this stage. The above price zones are established by comparing XRP’s performance from December 2024 to the present with changes in the M2 money supply. Should XRP experience sharp surges or crashes, the target ranges may shift accordingly. However, the broader trend often serves as a valuable reference point in investment planning.
I hope this help! KEEP CALM AND ROLL ON!
XRPBULLUSD trade ideas

XRPUSD - Wave 4 completion.Major Trend : Uptrend
Minor Trend : Downtrend (Retracement)
Note: At this moment I still see the price structure as retracement to complete Wave 4. I don't know whether it's already completed or can go down further.
This is only my EW view. Not recommended to trade based on this EW counting. Must do your own analysis prior to placing a trade.

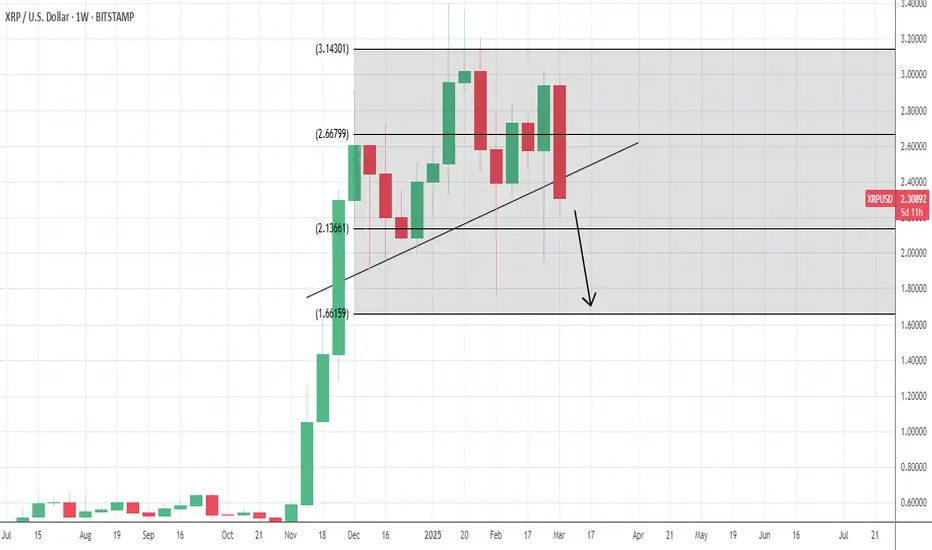
XRPUSDAnalyzing the XRP/USD chart on the weekly timeframe reveals a well defined head and shoulders pattern, which typically signals a potential trend reversal. In light of this, it is crucial to identify key support levels where the price might stabilise and potentially reverse back to the upside.
To estimate the potential price movement, I use a measurement from the neckline to the head of the pattern, which in this case suggests a retracement of approximately 50%. This projection points to the $1 level as a significant support zone. However, before reaching this level, the $1.40 support area could provide an interim floor for the price. If $1.40 fails to hold, the next support level would be around $1.10, and if that also breaks, $1 becomes a critical level to watch.
This scenario could present an excellent opportunity for investors to acquire XRP at a relatively low cost, potentially marking one of the last chances to do so before the Moon

"Weekly Chart Analysis for Ripple (XRP) – Trends and Trade Oppor"In this analysis, we have examined the price action of Ripple (XRP) on a weekly timeframe. Using technical analysis tools such as trendlines, support and resistance levels, and chart patterns, we assess the current market situation. Key levels and potential price movements are discussed, with possible trading opportunities for the upcoming weeks. Additionally, fundamental analysis and related news events impacting Ripple have been considered to provide a more comprehensive outlook of the market."

XRP🔷 XRP expecting to retest the $2.10 inverse fair value gap very soon.
If we're able to sustain price above $2.10 we will continue moving higher looking towards ATH.
If we fail and move lower, I'm expecting to bounce off the $1.73 price range for more buying.
Lock in 🔒

bloodbath is still not overThe bloodbath is still not over we ill touch $1.20 - .98 cents then slowly go up

XRP/USD: Head and Shoulders Breakdown — Measured Target in FocusWe have a clear Head and Shoulders top formation on the daily chart:
📌 Head at ~$3.30
📌 Neckline at ~$2.00
📐 Pattern height: ~$1.30
After the neckline break, XRP/USD is now retesting the broken support zone (~$2.00–$2.05). Unless price reclaims this level convincingly, bearish continuation is the dominant scenario.
🧩 Measured Target Projection:
Neckline−Height=2.00−1.30= 0.70USD
🔍 Key Levels to Watch:
Resistance: ~$2.00–$2.05 (retest zone)
Intermediate Targets: ~$1.50, ~$1.20
Full Pattern Target: ~$0.70
⚠️ Risk Consideration: If XRP reclaims and holds above ~$2.05, the bearish thesis is invalidated.
Perspective: Unless a major bullish catalyst emerges, further downside is anticipated.
I’m actively building my trading analysis skills and sharing perspectives like this to engage with the community. I welcome any insights, feedback, or alternative views as I continue to refine my approach. Let’s learn and grow together.
#XRP #Ripple #Crypto #HeadAndShoulders #TechnicalAnalysis #Breakdown #Bearish #PriceAction #Trading

Ripple May Face Another Rally This YearRipple with ticker XRPUSD hit all-time highs for the final blue wave V as expected, so we should be aware of limited upside this year. However, despite recent slowdown, which we see it as an ABC correction within red subwave (IV), there can still be room for another rally this year, at least up to 4-5 area to complete final subwave (V) of V of an impulse on a daily chart.

XRP Wyckoff Accumulation??Tariffs hit the market hard but crypto still holding strong. Will there be capitulation or is XRP telling us something with this accumulation? Could this have been spring??

XRP Long Term Projection ModelAn evolving projection on XRP. Using time and experience in the market as well as Elliot Wave methods this is my projection of the market.
** WARNING: THIS CRYPTO IS HEAVILLY MANIPULATED **

Ripple Bounced, What's Next? FenzoFx—XRP bounced from $1.621 and found resistance near $2.0. Traders should watch the $2.218 resistance area for bearish signals, such as candlestick patterns, to join the bear market.
>>> Trade XRP/USD without swap at FenzoFx decentralized broker.

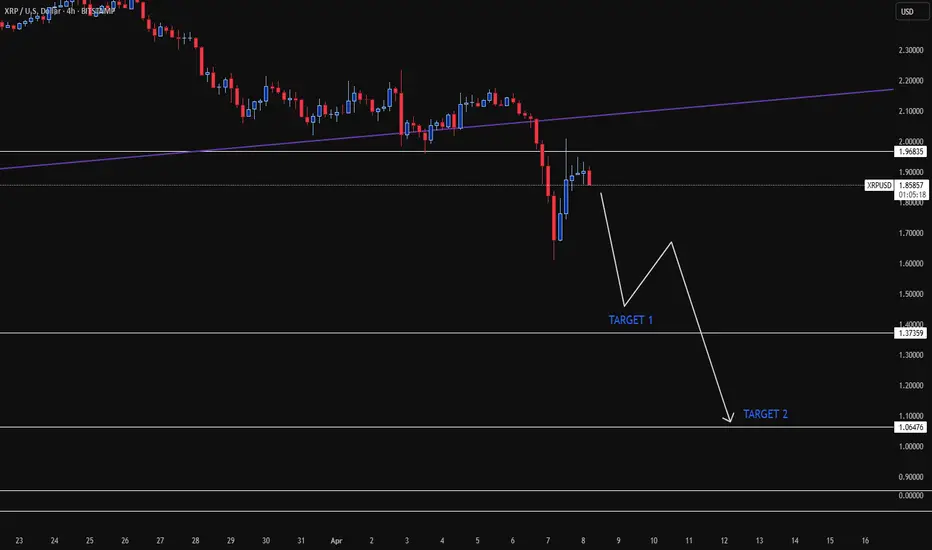
#XRP BROKE CRITICAL SUPPORT#XRP broke the critical bullish trendline which started back in November. We have had a pullback to the BOS zone which also resulted in a rejection candle on the 4h chart.
Looks like we can now expect to drop to the next support zone which sits at $1.37.
This would now indicate that we are in a bear market as per TA, however, the recent price action and not only in crypto is due to economic news and the market is very volatile at the moment so not FA and any news can trigger a change in direction. Trade carefully and always use SL!
XRP just found bounce support on the bttm trendline of the wedgeLooking like a very valid pattern on the weekly hart. My guess is it will break upward somewhere around where I have arbitrarily placed the dottedmeasuredmove line, in which case the breakout target would be somewhere around $4.80 always a chance we retest the bottom trendline and even send a wick below. It before confirming a break upward though. *not financial advice*

0.93 We are not going up.I repeat! We are not going up. Don’t let anything fool you we are under major line and we are going to come down.
I only have 50% of my trade still short, however we are not going up yet!

Alts Close to an Obvious Break Now. Alts have been in a bear trend all of the year so far. Topping mostly on harmonic patterns at the start of the year.
See full post about that here:
Since this time, we've completed multiple further steps of trend failure.
Let's run through them.
First let's refer to my template of things you tend to see in the public during stages of a bubble. It's a multi step process, we'll skip to the advanced stages.
We have the public trap (Sharp convincing spike - happened when the harmonics filled I think).
Then we have the rug pull. A very clean and consistent sell off from the high during which people bury their head in the sand and use phrases like "Ignore the FUD".
Then we're into the Early Panic stage where the market sells off about 50% and then puts in a bit of a bounce.
We'd now be in the "mimic the convincers" part. Where the market acts like it did before the previous rallies. The bit where people are common duped into making lifechanging decisions. And the time when it's most important to be warn people about the bubble - but the time they simply will not listen.
After this break, is when we tend to head into the lower lows crash section of the trend which develops into a long term grinding downtrend.
As well as going through all the classic public phases of a bubble, we now have the classic things like head and shoulders to warn the break may be imminent.

Can we see another short on xrp?Our first trade was perfect, seeing a nice channel and downward resistance forming. Placing a low risk on this one.

Bearish Signal Alert for Ripple (XRP)Ripple (XRP) has just triggered a major bearish signal by breaking below the crucial support level of $2.3575. This recent move is a significant indicator for potential further declines in the price of XRP. Investors and traders should closely monitor this development, as the break below $2.3575 could lead to an acceleration in bearish momentum.
Looking ahead, the next major support area to watch is around $1.7. If Ripple's price continues to descend, we can expect it to potentially target this next critical support level. Traders might consider this as a strategic point for assessing market responses, with the possibility of further downside if this level fails to hold.
It is advisable to approach trading with caution during this period and consider adjusting stop-loss orders to manage risks effectively. This bearish development could present opportunities for short sellers, but also warrants vigilance for any signs of a reversal or support at lower levels.
Ripple dives as predicted; what is next?
This content is not directed to residents of the EU or UK. Any opinions, news, research, analyses, prices or other information contained on this website is provided as general market commentary and does not constitute investment advice. ThinkMarkets will not accept liability for any loss or damage including, without limitation, to any loss of profit which may arise directly or indirectly from use of or reliance on such information

XRP The bottom is in. We are awaiting the big news to push price higher. It can be in the next few hours, days, weeks or a month. But we will go so much higher.
Lock in.

XRP/USD Short Trade Setup Analysis (9H Timeframe - Bitstamp)🔹 Current Setup:
- 📈 XRP experienced a strong move upward following ETF news but is now approaching major resistance.
- 🔹 Price is testing the 0.618 Fibonacci retracement level at $2.66 , aligning with the descending channel's resistance.
- 📉 Given the broader bearish trend , a rejection from this level could trigger a strong downside move.
- 📍 Key Resistance Levels (Potential Rejection Zones):
- 🎯 $2.87 (0.764 Fibonacci retracement & upper channel resistance)
- 🎯 $3.21 (Full Fibonacci retracement, invalidation level for bears)
- 📍 Key Support Levels:
- ❗ $2.48 (0.5 Fibonacci retracement)
- 🔻 $2.36 (0.382 Fib retracement)
- 📉 Deeper Target: $1.36 - $1.40 XRP (Projected based on Fibonacci extensions & channel breakdown)
📈 Bullish Scenario (Breakout Play)
- 🟢 Entry: Above $2.87 (If price breaks above 0.764 Fib)
- 🎯 Take Profit 1: $3.21 (Full retracement level)
- 🎯 Take Profit 2: $3.50+ (Potential bullish expansion)
- 🔴 Stop Loss: Below $2.66
✅ Justification:
- 🔹 If price breaks and holds above $2.87 , the bearish structure could be invalidated.
- 🔹 Momentum from the ETF-driven rally might fuel another leg up beyond $3.00.
- 🔹 A strong breakout above $3.21 would confirm a bullish reversal.
📉 Bearish Scenario (Primary Expectation)
- ❌ Invalidation Level: Above $3.21
- 🔻 Downside Targets:
- $2.48: 0.5 Fibonacci retracement
- $2.36: 0.382 Fibonacci retracement
- $1.76: Key structure support
- $1.36 - $1.40 XRP : Final bearish target (0.272 Fib extension & channel bottom)
✅ Justification:
- ❗ Price remains within a descending channel , signaling a continuation of the downtrend.
- ❗ The ETF-driven pump appears to be a liquidity grab , leading to a likely reversal.
- ❗ A rejection from $2.66 - $2.87 would confirm bearish continuation, targeting the lower support zones.
⚡ Key Takeaways:
- 🔹 XRP is facing strong resistance at $2.66 - $2.87 , a likely rejection zone.
- 🔹 A breakdown below $2.48 increases bearish pressure , targeting $1.40 XRP.
- 🔹 Bearish bias remains unless price breaks & holds above $3.21.
- 🔹 Expect price to follow the descending channel structure toward $1.36 - $1.40.

XRP now approaching buy zone at 1.55-1.60 levels as forecastedAs indicated in prior posts, XRP is now approaching the liquidity target levels at 1.55-1.60 levels as part of a final liquidity run.
Possibility exists for extended sell wave as low as 1.06 (worst case scenario imo) but most likely scenario is that 1.35-1.55 will be the zone in which the final low on the consolidation structure is formed. The next move is gearing up to be explosive towards 10$ & then on towards 100$ range once 10$ fails to hold as resistance.
I am convinced we will witness progress on towards 500's within several years (assuming comprehensive integration into financial system etc)...time will tell if we get into the 1,000's!!!
Hope this helped some of you gain (re-)entry at greater discounted levels!!

Juicy 0.93 incoming!I tried to tell you all :) Enjoy that juicy drop!
0.93 is inevitable :) Like Thanos, it’s coming!

Possible Distribution Scheme in XRP (Chaotic Scenario)Someone asked me what the most chaotic scenario for XRP's price could be — and I answered: a long-term Distribution phase.
In this image, I illustrate a radical distribution scheme that could potentially extend into late 2025. But first, a sign of weakness — with price dropping below the Corona Dump levels, possibly close to $0.10. Sounds absurd to many, I know.
If it's Scheme 1, XRP would drop and then bounce back to the Last Point of Supply (yellow line).
If it's Scheme 2 (red line), price could spike between $5 to $6.8, with an average peak around $5.5–$5.7, likely triggering extreme euphoria.
But remember, this is just one insane possibility — and it depends heavily on Bitcoin, Market Makers, Supply vs Demand, public interest, and the macroeconomic context.
If this scenario plays out… what would YOU do?
