XRP 24hr potterboxesXRP 24 hr potterboxes . Well, it looks like ZRP has gone down and touched the 50 percent mark of the lower box.$2.400ish it came up to the top of the box and is now headed back down to the 50 percent line. $2.400 ish of the lower box. just keep a eye on it.
XRPBULLUSDT trade ideas
XrpStill like it
Purple boxes are my targets.
Same trade from last night.
Likely the start of a pull back to 1.60 area

$XRPBullish sentiment for $XRP.
As we bounce off lower support, we're looking to cross $2.81 Order Block (OB). If we are able to break above with a solid retest, we may be on our way too $3 heading into the new week.
If we fail to break above $2.81, we may slide back down towards $2.75.
There have been plenty of ETF(s) filed, plus rumors of David Sachs announcing the government moving ahead with crypto reserves. Which would include XRP, we are still waiting for clarification.

2x for xrpusdt or 1/2 ? that's the questionyou can see that xrp has broken the old all time high and did a pullback and it seems that we are waiting for a 150% rally but another scenario is that it may be a fake breakout and it would go back into the wide wide trading range that it has been inside 60% probabilty is in favor of an 150% rally but let's see what would happen

XRP/USDT Short Opportunity: Daily CHoCH and Fresh Supply Zone XRP/USDT is presenting a high-probability short opportunity as it approaches key technical levels. A Change of Character (CHoCH) on the daily timeframe signals bearish momentum, while a fresh H1 supply zone at $2.42 could serve as a strong resistance point. With these factors aligning, a potential downside move to the $2.18 level is in focus.
Key Technical Factors Supporting the Short
Daily CHoCH Formation:
XRP/USDT has printed a CHoCH on the daily chart, indicating a shift from bullish to bearish market structure. This signals a possible trend reversal as sellers begin to take control.
H1 Fresh Supply Zone at $2.42:
On the H1 timeframe, a newly formed supply zone around $2.42 aligns with the bearish narrative. This zone is likely to act as a strong resistance, providing an ideal entry point for short positions.
Target Level at $2.18:
If the supply zone holds, the next logical support level lies at $2.18, making this a reasonable take-profit target.
Risk Considerations
Volume Confirmation: Ensure there is bearish momentum (increased sell volume) as price taps the supply zone.
Invalidation: A clean break above $2.45 would invalidate the short setup.

Xrp to collapse back to $2.1...Today?Just set a limit order to short xrp .
Limit entry: $2.34
Stop: $2.3721
(bybit exchange)
Miss manual entry earlier and gotta go get some sleep now. If not filled by time am awake...roughly next 4hrs. Then I will cancel order and wait for manual entry or skip

XRP/USDT 1H: Strong Momentum – Targeting $2.80?XRP/USDT 1H: Analysis
🚀 Follow me on TradingView if you respect our charts! 📈 Daily updates!
Current Market Structure:
Bullish breakout above $2.40 resistance, confirming upward momentum.
Price at $2.48, with RSI at 59.44, indicating strength but not yet overbought.
Smart Money Concepts:
Accumulation seen in the $2.30-$2.40 zone, forming a clear Order Block (OB).
Liquidity likely being engineered for a push toward premium levels.
Key Levels:
Support: $2.30 (Point of Interest - POI).
Resistance: $2.60, $2.80 (premium zone).
Stop Loss: Below $2.28 (recent low).
Targets:
T1: $2.60 (first resistance level).
T2: $2.80 (premium zone).
Hidden Divergence:
Bullish hidden divergence on RSI supports continuation to the upside.
Risk Score:
8/10 – Strong setup with clear risk-to-reward and well-defined invalidation.
Market Maker Intent:
Smart Money likely accumulating within the demand zone for a move to the premium zone.
Key levels at $2.60 and $2.80 could serve as magnet areas for liquidity grabs.
Recommendation:
Long entry favorable at current price ($2.48).
Maintain tight stops below $2.28 to minimize risk.
Watch for price action near $2.60 for potential reaction before further upside.
Confidence Level:
8/10 – Strong bullish structure with Smart Money accumulation signals.
🚀 Follow me on TradingView if you respect our charts! 📈 Daily updates!

XRPUSDT CHART ANALYSİS-EDUCATİONAL POSTDifferent Types of Crypto Trading
There are many ways to trade. Each trader might have their own favorite strategy, or combine a few. Here are two examples of crypto trading strategies we use at EngineeringRobo.
1) Trend following
These strategies move in line with the market. According to this approach, you should buy an asset when its price goes up and sell it when it goes down. Why is that? Because you are expecting price movements to continue in the same direction.
2) AI BUY - AI SELL
EngineeringRobo AI strategies leverage artificial intelligence to make buy/sell decisions. They automatically choose among the different strategies available at a given time, based on predictions for the short-term future.
3) Smart Money
4) AI Social Intelligence Score

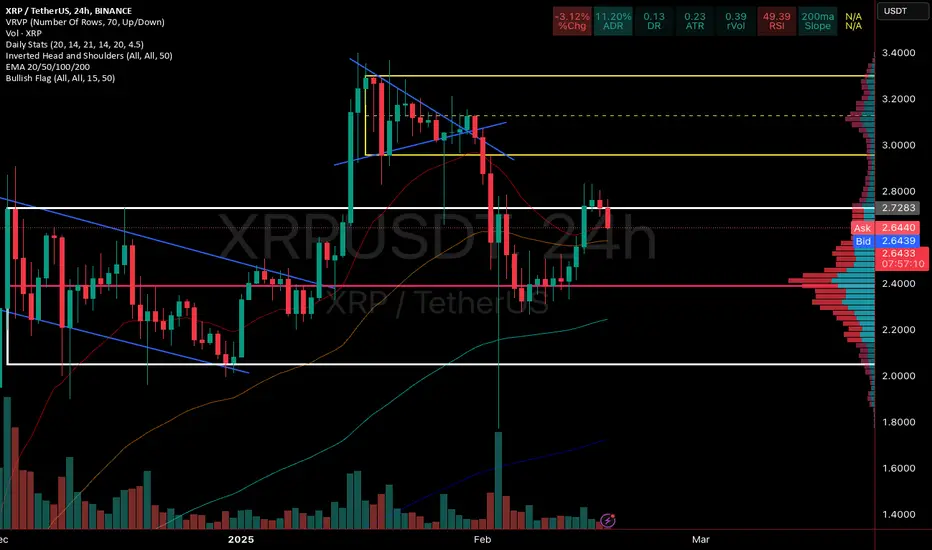
XRP at Crucial Trendline Support: Bounce or Breakdown Ahead?XRP is currently holding at a key trendline support within an ascending channel. This level has acted as strong support in the past, and if it holds, we could see a potential bounce.
Support Zone: XRP is testing the lower trendline support, aligning with the 200 EMA.
Potential Rebound: If price holds this level, we may see a bounce towards the next resistance at $2.71 (0.236 Fib level).
Breakdown Risk: A breakdown below this trendline support could trigger further downside, targeting the $1.95 zone.
Monitoring how XRP reacts at this support will be crucial for the next move.
#XRP #Crypto

#XRP LongOkay, let's analyze the XRP chart to see if there's a potential long entry setup.
Disclaimer: This is technical analysis based on the chart provided and should not be considered financial advice. Trading involves risk, and you should do your own research before making any decisions.
Overall Impression
Based on the chart, XRP appears to be showing some signs of a potential bullish reversal after a recent downtrend. Here's a breakdown of the key observations:
Key Observations
* Current Price Action: XRP is currently trading around $0.25292.
* Potential Support: There's a defined support level at approximately $2.3207, which price has recently bounced off. This suggests buyers are stepping in at this level.
* Moving Averages:
* The price is currently below both the 50-period Simple Moving Average (SMA).
* MACD Crossover Signals: The MACD indicator shows a bullish crossover signal. This suggests that the short-term moving average has crossed above the long-term moving average, which can be interpreted as a potential buy signal.
* KelvinMOM Indicator: The KelvinMOM indicator shows the price may be looking for a reversal here.
Potential Bullish Scenario & Long Entry
Given these observations, here's a potential bullish scenario and how you could approach a long entry:
* Entry Point: A possible entry point would be around the current price ($2.5292), or upon a confirmed break above the 50-period SMA.
* Stop-Loss: A stop-loss order should be placed below the recent support level at $2.3207. This would limit your risk if the price reverses and breaks below support.
* Target: Potential price targets could be set at $2.8599, or $3.1942.
**Important Considerations**
* Risk Management: The suggested stop-loss placement results in a 10% loss if the trade goes against you, and the target of $2.8599 would result in a 13% gain. Adjust position size to align with your risk tolerance.
* Confirmation: It's generally wise to wait for further confirmation before entering a trade. This could include a strong bullish candlestick pattern, increased trading volume, or a break above a key resistance level.
* Market Conditions: Keep an eye on overall market conditions and news related to XRP, as these can significantly impact price movements.
In Conclusion
The chart suggests that XRP may be presenting a potential long entry opportunity. The bullish MACD crossover, combined with price bouncing off support, indicates a possible reversal. However, it's crucial to practice proper risk management, wait for confirmation, and consider overall market conditions before making any trading decisions.

XRP/USDT-12H-BINANCEThis is not a financial advice. Always do your own research and always put stoploss in your trade (SL) :) If you want more detailed info
how to study and read charts or just need help with some coin, just write to me here a comment, i will try to answer to everybody...
i can help you :) all for free, don't worry, BE HAPPY!

Ripple analysis: when to buy?hello friends
According to the drops we had, now the price has reached the specified support range, which is also an important range, and by maintaining it, it can move up to the specified targets.
*Trade safely with us*

XRP Is Warming Up Will This Breakout Ignite a Rally ?XRP is currently trading at 2.30, moving within a descending channel formation. This pattern is typically bullish, suggesting that a breakout may occur soon. The price has been respecting the channel boundaries, making lower highs and lower lows, but momentum is showing signs of potential reversal.
A critical support level lies at 2.25, where buyers may step in to prevent further downside. If this level holds and the price forms a bullish candlestick pattern, such as an engulfing candle or strong green close, it could indicate the start of an upward move. On the upside, the key breakout level is at 2.42, where a decisive 1H candle close above this level would confirm bullish momentum.
Using Fibonacci retracement from the recent high of 2.70 to the swing low of 2.25, important levels align with structural resistance. The 0.382 retracement around 2.40 to 2.42 coincides with the upper boundary of the descending channel, making it the first confirmation zone. The 0.5 level at 2.48 is a mid-range resistance, while the 0.618 level at 2.55 to 2.57 serves as a strong bullish target if the breakout occurs. Additionally, the 1H 50 EMA is positioned near 2.35 to 2.38, acting as dynamic resistance that, once reclaimed, would further validate the bullish move.
Momentum indicators suggest that the market is at a crucial juncture. The RSI is currently below 50, indicating weak momentum, but if it moves above 55 to 60, it would confirm a shift in trend strength. Volume has been decreasing, which often precedes a breakout, meaning a sudden surge in volume above 2.40 would validate buyer interest and increase the probability of a sustained upward move.
For a trade setup, the ideal long entry would be upon confirmation of a bullish candlestick pattern, especially if accompanied by a breakout above 2.42. The first target would be 2.48, aligning with the Fibonacci 0.5 level, followed by 2.55 to 2.60, where further confirmation of bullish momentum is expected. A stop-loss should be placed below 2.25 to mitigate the risk of fakeouts and potential downside continuation.
If the price successfully breaks above 2.42 and sustains momentum, it could lead to a rally toward 2.60 and beyond. However, if support at 2.25 fails, the price could retrace further toward 2.20 to 2.15 before finding stability. It is crucial to wait for a proper breakout confirmation before entering a trade to avoid unnecessary risks.

XRP - RIMC Pattern, Broadening WedgeXRP is in the mitigation phase of the RIMC pattern (Range, Initiation, Mitigation, Continuation).
Its also in a broadening wedge, which is bullish.
I expect to see a big move in the coming weeks that expands out of the wedge to the higher fib levels.
If 2.85 is reclaimed, its very bullish

Phemex Analysis #57: How to Trade XRP Like A ProXRP has been on a wild ride. Following our last analysis on December 11th , XRP peaked at $3.40, only to plummet nearly 50% to $1.76 after forming a third higher top with RSI divergence. Recently, we've seen a resurgence, with XRP climbing back up to around $2.36 – a 34% rebound. But where does it go from here? Is this a prime "buy the dip" opportunity for long-term holders, or is further downside on the horizon? Let's explore some potential scenarios.
Scenario 1: Building a Base for a Comeback
Imagine XRP consolidating its recent gains. Instead of another sharp drop, it finds a footing, establishing a base around $2, or even down to $1.80 if current support falters.
This scenario would be characterized by: Accumulation signs near these levels, with higher RSI values and lower trading volume compared to the previous declines. This could indicate renewed buying interest.
Pro Tips:
Closely monitor volume and RSI. If they align with base-building conditions (higher RSI and lower volume), consider gradually entering long positions. Crucially, set stop-losses below key support levels to manage risk.
Scenario 2: The Bear's Grip Tightens
Now, picture this: The recent rally loses steam, and XRP breaks below critical support. A sharp drop below $2, accompanied by high trading volume and lower RSI compared to the fall from $3.40, could signal further trouble.
In this bearish scenario, traders should brace for potentially deeper declines towards support zones around $1.3, $1.0 or even historical lows seen in past bear markets.
Pro Tips:
Exercise caution. Avoid entering trades until a clear direction emerges. Consider shorting opportunities if the price breaks below key supports (e.g., near or below current lows) with higher volume and lower RSI than previous drops.
Scenario 3: A Period of Calm – Consolidation
Another possibility is that XRP enters a period of consolidation, fluctuating between resistance around $3 and support near $2. During this period of reduced volatility:
Traders can capitalize using Phemex Grid trading bots to capitalize profits from these small price fluctuations.
Pro Tips:
Set up long grid bots near the lower boundary (support) to buy as prices rebound. Position short grid bots near the upper boundary (resistance) to sell as prices approach. Remember, stop-losses are essential to manage risk if the price breaks out above resistance or falls below support.
The Big Picture: Staying Ahead of the Curve
Trading XRP requires a keen awareness of both broader cryptocurrency market trends and Ripple-specific news, such as regulatory developments that could impact investor confidence.
Whether you're navigating a sharp drop (Scenario 2), capitalizing on consolidation (Scenario 3), or preparing for other potential scenarios, discipline and adaptability are paramount. By staying informed, managing risk, and adapting to changing conditions, you can trade XRP Like A Pro!
Final Tips:
Trade Smarter, Not Harder with Phemex. Benefit from cutting-edge features like multiple watchlists, basket orders, and real-time strategy adjustments. Our unique scaled order system and iceberg order functionality give you a competitive edge.
Disclaimer: This is NOT financial or investment advice. Please conduct your own research (DYOR). Phemex is not responsible, directly or indirectly, for any damage or loss incurred or claimed to be caused by or in association with the use of or reliance on any content, goods, or services mentioned in this article.

Long TargetsHello, trader.
Now that we got the first correction on the next leg, we can get a better idea of price targets for XRP.

XRP some thoughts I seen sometimes when there is sharp fall & recover happen quickly, chart started to follow spike candle slowly slowly

XRP Price Recovery Hinges on Bitcoin’s Next MoveXRP recently attempted to break its all-time high but faced strong resistance, triggering a wave of selling pressure. Now, XRP’s fate is closely tied to Bitcoin, with a 0.92 correlation, meaning BTC’s price action could dictate XRP’s next move.
Key Bearish Signals for XRP:
🔻 Supply in Profit Dropped – XRP’s profit supply fell 3% after exceeding 95%, increasing selling pressure.
🔻 Critical Supports Lost – XRP fell below $2.95 and $2.70, now stabilizing around $2.46 with support at $2.33.
🔻 Investor Sentiment Wavers – If more holders sell to lock in profits, further downside is likely.
Will Bitcoin’s Recovery Lift XRP?
📈 Bitcoin Eyes $100K Support – If BTC stabilizes and climbs higher, it could fuel a market-wide recovery.
📈 Key Resistance for XRP – Breaking $2.70 is crucial for upside momentum. A move past $2.95 would invalidate the bearish outlook and set XRP up for further gains.
For now, XRP consolidation below $2.70 remains likely unless Bitcoin regains strength. If BTC pushes past $100K, XRP could follow, marking the beginning of a new bullish wave. 🚀

XRP will be going down.I expect a correction in the entire crypto market and more so in altcoins.
The meeting of the Federal Reserve System (FRS) in January 2025 will be held on January 28-29. I expect that the rate will not be changed. There will be no downgrade.
Chinese New Year is usually celebrated between January 21 and February 21, which means a reduction in the activity of market participants.
Analysts at Trading Economics predict that the M2 money supply in the US will total $21,550 billion by the end of 2025.
M2 money supply is the volume of money in the economy: cash, deposits in banks, time deposits and other financial instruments.
Causes of a decrease in the M2 money supply:
-Rising interest rates. When interest rates rise, people and companies borrow less money and this squeezes M2.
-Inflation. When it is high, people and companies spend money faster, which also squeezes M2.
All of this indicates that a bear market is coming for the U.S. and cryptocurrencies as well.
Translated with DeepL.com (free version)

Diamond chart Pattern The diamond chart pattern is a technique used by traders to spot
potential reversals and make profitable trading decisions. Diamond
patterns often emerging provide clues about future market movements.
In a diamond pattern, the price action carves out a symmetrical shape
that resembles a diamond. This occurs as buyers and sellers battle for
control, getting squeezed into an ever-tightening range. The tension
builds beneath the surface until one group ultimately breaks the
stalemate.

$XRP What trend to expect today?Good morning all,
Today my idea is that XRP will be in bullish trend, good news ahead.
Good Luck All!

Bearish Phase Continues: XRP's 25% Decline Possible Target $1.80Hello and greetings to all the crypto enthusiasts, ✌
Reading this educational material will require approximately 2 minutes of your time. For your convenience, I have summarized the key points in 2 concise lines at the end. I trust this information will prove to be insightful and valuable in enhancing your understanding of market and Ripple.
Personal Insight & Technical Analysis of Ripple:
It is conceivable that we may witness upward candlestick formations as part of the completion of the ongoing bearish phase. I have depicted this potential scenario clearly on the chart, which should provide clarity on the matter. However, there remains a distinct possibility that Ripple may experience further depreciation from this point. In fact, I foresee an additional decline of at least 25% for this asset, with a target price set at $1.80.
The bearish cycle we are currently observing is far from over.
One of the significant indicators of its continuation is the failure of spot prices to rise in proportion to their potential, despite initial expectations. Furthermore, these spot prices have consistently fallen in response to Bitcoin's periodic downturns and have not been able to recover their losses following Bitcoin's price recoveries. In simpler terms, it appears that the much-discussed altcoin season in the market has been short-lived. This was particularly evident for certain altcoins, including highly regarded ones such as Ethereum, which failed to achieve the levels of growth many had anticipated.
This brings me to a critical observation: why, when Bitcoin achieved a new all-time high, was Ethereum unable to surpass the $5000 threshold? The question becomes even more pressing when we consider that after a market correction, during which Bitcoin regained its position, many other altcoins continued to slide, indicating a lack of positive momentum in the broader market.
These factors point to a larger trend of ongoing market weakness, suggesting that additional declines may be inevitable. The inability of Ethereum and other altcoins to capitalize on Bitcoin's strength, especially during a bull run, signals a more complex and challenging market environment. This ongoing pattern highlights the fragility of altcoins, particularly in relation to Bitcoin's dominant influence. Therefore, it seems prudent to expect further downward pressure across the board as we navigate the remaining phases of this cycle."
This version aims to be more in-depth, offering both an analysis of the current situation and an explanation of potential future market movements, all while maintaining a professional and polished tone.
However ,
This analysis should be seen as a personal viewpoint, not as financial advice, and it’s important to be aware of the high risks that come with investing in crypto market and that being said, please take note of the disclaimer section at the bottom of each post provided by the
🧨 Our team's main opinion is: 🧨
We might see some upward candles as part of the current bearish phase, but Ripple could still drop another 25%, with a target price of $1.80. The ongoing market weakness is evident, as spot prices aren’t growing as expected, and altcoins like Ethereum couldn’t capitalize on Bitcoin’s new all-time high. This suggests more declines ahead for the broader market.
Give me some energy !!
✨We invest countless hours researching opportunities and crafting valuable ideas. Your support means the world to us! If you have any questions, feel free to drop them in the comment box.
Cheers, Mad Whale. 🐋

XRP Bullish Setup In a Short Term📈 There Is a Bull Flag Formed At The XRP Chart In a 1H Timeframe And Wave C Completed At The 1.618% PRZ, Expect a Bullish Rally From Here Toward a 3.06$
