XRP USD 24hr potterbox and a wedge XRP is forming up a nice get ready to blast off wedge. it's well above the 200-day moving average. I'm not sure i drew the box and wedge correctly . I have seen this pattern and most of the time its bullish. I could be wrong, and we will see. Happy Trading.
XRPBULLUSDT trade ideas

XRP 4HR Big Pennant breakout attempt XRP 4HR Big Pennant breakout attempt. XRP is attempting to break out of its big bullish pennant pattern. Im taking a small position on a close above the trendline then waiting for a re-test. Measured target is $4.20

XRP - Waiting on E Wave CompletionUpdated playout chart on XRP escaping contracting triangle. Should not revisit $2.65 C Wave low

big hammer pattern The hammer candle is at the bottom of the channel with this size and also in green
And its confirmation with the candle after it
Indicates that it is moving strongly upwards
And I don't think there is much correction coming and it is only moving upwards
Also, the news of the dismissal of the lawsuit against Ripple has just come out, which I think could be another reason for Ripple's flight
So fasten your seatbelts because we are going up very fast

Just mark it, it is now or never to buy XRP.. The chart is looking very very good, people are still buying in everytime is drops..

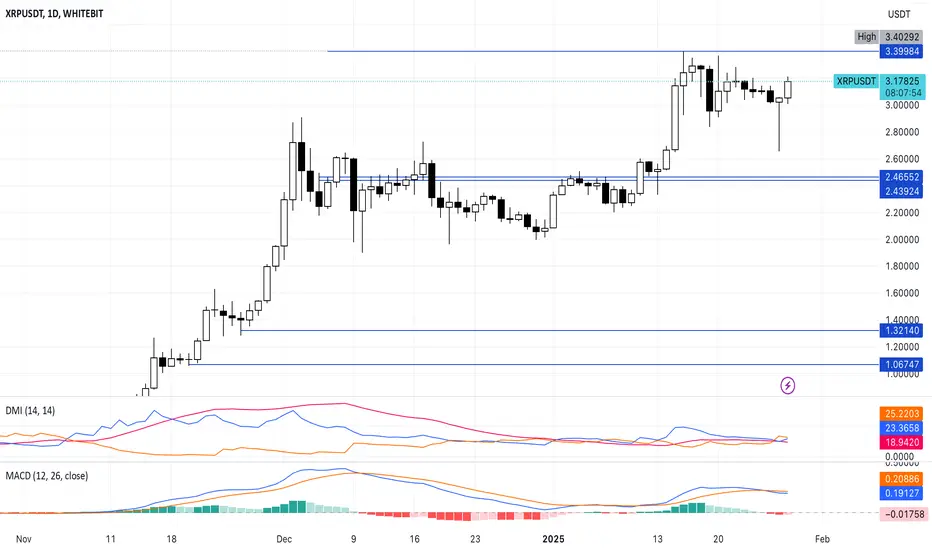
Massive Whale Activity Fuels Bullish Hopes for XRP RallyThe crypto market is shaking off selling pressure sparked by the launch of DeepSeek, an innovative AI model that hit the AI sector hard. Amid this turbulence, XRP has rebounded impressively, recovering from a dip below $2.7 to climb 10% in the last 24 hours, trading at $3.15. Notably, this surge comes as trading volumes drop by 18%, hinting at passive bearish pressure and setting the stage for a potential breakout.
XRP continues to trade within a bullish pattern, supported by massive whale activity. Recent data reveals that whales accumulated nearly 120 million XRP during the dip, with 25 million XRP purchased on Upbit and moved to unknown wallets. This accumulation underscores growing confidence among major players, aligning with bullish market sentiment.
Technical indicators further support the bullish case. XRP’s MACD and DMI are primed for a bullish crossover, signaling momentum for a breakout. The ADX remains low, suggesting that the bulls are in an accumulation phase, while the on-balance volume is incrementally rising, confirming strong buying interest.
The Chaikin Money Flow indicator, heavily above zero, signals strength in the ongoing rally. XRP is currently consolidating near the 0.786 FIB level at $2.77. A breakout above this zone could see the token surpass the 1 FIB level, targeting a new all-time high at the 1.2 FIB level of $4.18.
With whale activity, bullish technicals, and improving market sentiment, XRP is positioned for a strong breakout. Will this rally push XRP to new heights? The next few days could be pivotal.
Uptrend #XRPXRP coming hard, and is stying on the uptrend buying and whales are coming hard to take all the XRP away..
Something is coming on 2025


#XRPEvery low it hits is a buying opportunity.
It may take time to reach these targets, but it will because Mark has proven that the price always returns to the shadows it hits.
Because there are general buy orders at those points.
Look at the old shadows, the price has reached them again and returned to the top.

It feels like it's $XRP season!🔔 😤
The paradigm is shifting—no more jokes about CRYPTOCAP:XRP holders! 🚀
Market cap x2 increase is looking real as XRP pushes into price discovery mode.
🏹 #Ripple remains a strong bet, and this breakout could be historic!
Time to break the multi-year ascending resistance! 🔥

Mr.Million | Current XRP Chart Analysis and my current positionI believe XRP has completed (or is close to completing) Wave (5) (in white). I’m in a low-leverage (2x) SHORT at ~ $3.06, targeting Wave (4) lows ~ $2.20. HODL!

XRP/USDT 1H: Bulls Charging Toward $3.25 !XRP/USDT 1H Chart Analysis (Smart Money Concepts)
🚀 Follow me on Tradingview if you respect our charts 📈
Current Market Structure:
Bullish momentum following a break above $3.10 resistance.
RSI: 65.55, indicating strong momentum but nearing overbought conditions.
Key Levels:
Support: $3.10
Resistance: $3.25 (premium zone).
Fair Value Gap (FVG): $2.90-$3.00
Trade Setup (Confidence Level: 8/10):
Entry Zone: $3.12-$3.13 (on pullback).
Targets:
T1: $3.20
T2: $3.25
Stop Loss: Below $3.08 (recent swing low).
Risk Score: 7/10 (moderate risk with tight management).
Market Maker Analysis:
Accumulation phase confirmed at $2.70-$2.80.
Distribution likely above $3.25.
Volume profile supports continuation toward premium zones.
Recommendation:
Long position is favorable within the $3.12-$3.13 range.
Watch for a clean breakout above $3.20 to confirm continuation to $3.25.
Manage risk with a stop below $3.08.
Confidence Level: 8/10 for bullish continuation.
🚀 Follow me on Tradingview if you respect our charts 📈

XRP/USDT Technical Analysis – 4H ChartOverview:
The chart represents the XRP/USDT trading pair on a 4-hour timeframe from Binance. The price is currently around $3.102, showing consolidation after a previous sharp movement.
Key Observations:
Descending Channel Breakout:
The price was previously moving in a descending channel but has broken out aggressively to the upside before facing rejection.
Support and Resistance Zones:
Support: The price bounced off from a strong demand zone around $2.80 - $2.85.
Resistance: The key resistance level is at $3.10 - $3.15, followed by a major target at $3.40 - $3.41 (highlighted in yellow).
Possible Scenarios:
The price is forming a small consolidation pattern near the breakout zone.
A retest of the breakout level near $2.90 - $2.95 (highlighted box) before a bullish continuation is likely.
A confirmed breakout above $3.15 could push the price toward $3.40.
Bullish Setup:
The chart suggests a bullish bias, with a possible pullback to retest support before an upward move.
The expected target price after confirmation would be $3.40.
Trade Strategy:
Entry: Consider entering long positions if the price retests $2.90 - $2.95 and shows bullish confirmations.
Stop Loss: Below $2.80 to minimize risk.
Take Profit: Primary target at $3.40.
Conclusion:
XRP is in a bullish trend after breaking out of the descending channel. A pullback and retest of support could offer a strong buying opportunity, with a potential upside toward $3.40. Keep an eye on $3.15 resistance for confirmation of a breakout.

XRPUSDT? New highs
This week.
I have 3 levels
2 levels to test for breakout upside.
1 level to test for downside.
Level break.. retest will entry.
From here. I will set alerts on 3.15
Track from there
My stop below 3.000000000000000
All the best.

XRP Bollinger Bands Tighten: Price Explosion Ahead?XRP, the digital asset powering Ripple's payment network, has been a subject of intense speculation and trading activity within the cryptocurrency market.1 Recently, a key technical indicator known as Bollinger Bands has been exhibiting a pattern that often precedes significant price movements.2 This phenomenon, known as a "tightening" or "squeeze," has caught the attention of traders and analysts, raising questions about XRP's next major price swing.3
Understanding Bollinger Bands
Bollinger Bands, developed by John Bollinger, are a popular technical analysis tool used to measure price volatility and identify potential overbought or oversold conditions.4 The indicator consists of three lines plotted on a price chart:5
• Middle Band: A simple moving average (SMA) of the price, typically a 20-day SMA.6
• Upper Band: Calculated by adding a certain number of standard deviations (usually two) to the middle band.7
• Lower Band: Calculated by subtracting the same number of standard deviations from the middle band.
The bands widen when the price is volatile and contract when the price is stable.8 This dynamic nature of the bands provides traders with valuable insights into the degree of price fluctuations.9
The Significance of a Tightening
When the Bollinger Bands tighten, it indicates a period of low volatility.10 The price is confined within a narrow range, and the bands contract towards the middle band.11 This pattern often precedes a significant price movement, as the energy stored during the period of consolidation is released in a subsequent breakout or breakdown.12
The direction of the breakout is not predetermined by the tightening itself. The price can break out above the upper band, signaling a bullish move, or break down below the lower band, indicating a bearish move.13 Traders often look for other confirming indicators or patterns to anticipate the direction of the breakout.14
XRP's Tightening Bollinger Bands
In the case of XRP, the Bollinger Bands on the daily chart have been observed to be tightening.15 This suggests that a major price move could be on the horizon. The cryptocurrency has been trading within a relatively narrow range, and the bands have been contracting, indicating decreasing volatility.16
This tightening pattern has raised speculation about the direction of XRP's next major price swing.17 While the tightening itself does not provide a definitive answer, it does suggest that a significant move is imminent.18 Traders are closely monitoring the price action for signs of a breakout or breakdown.19
XRP Price Falling: Doji Candle Points to a Rally to $5+ After Crash?
Adding another layer of intrigue to XRP's price action is the recent formation of a doji candle. A doji is a candlestick pattern characterized by a small body and long upper and lower wicks.20 It indicates indecision in the market, as neither buyers nor sellers are in clear control.
Doji candles are often observed at turning points in the market, signaling a potential reversal of the prevailing trend.21 In the case of XRP, the doji has formed after a period of price decline, suggesting that the selling pressure may be waning.
Some analysts interpret this doji formation as a potential precursor to a rally, with some even speculating a surge to $5 or beyond. However, it's crucial to exercise caution and consider other factors before drawing definitive conclusions.
Additional Factors to Consider
While the tightening Bollinger Bands and the doji candle provide valuable insights, it's essential to consider other factors that could influence XRP's price action:
• Market Sentiment: The overall sentiment in the cryptocurrency market can significantly impact XRP's price.22 Positive news or developments could fuel a rally, while negative news or regulatory concerns could trigger a decline.
• Fundamental Developments: Ripple's ongoing legal battle with the U.S. Securities and Exchange Commission (SEC) continues to be a major factor influencing XRP's price.23 A favorable outcome could boost investor confidence, while an unfavorable outcome could have the opposite effect.
• Trading Volume: Increased trading volume during a breakout or breakdown can provide further confirmation of the move's validity. Low volume breakouts can be unreliable and prone to reversals.
Conclusion
The tightening Bollinger Bands on XRP's daily chart suggest that a major price move is imminent.24 The formation of a doji candle adds further intrigue, hinting at a potential reversal of the recent downtrend.
However, it's crucial to consider other factors, such as market sentiment, fundamental developments, and trading volume, before making any trading decisions. The cryptocurrency market is highly volatile, and prices can fluctuate significantly in short periods.25
Traders should exercise caution, conduct thorough research, and use appropriate risk management strategies. While the technical indicators provide valuable insights, they should not be the sole basis for investment decisions.

XRP - 4H Elliott Wave AnalysisGreetings, this is our Elliott Wave Analysis for the current XRP chart on the 4H timeframe.
Enjoy! :)
We assume that we have a blue Wave 1 in and work on a blue Wave 2 of the 5th Wave of a higher timeframe. Blue Wave 2 support sits between the 0.5 FIB at 2.8648 USD and the 0.786 FIB at 2.5587 USD. After blue Wave 2 is in we will look for an impulse to the upside in blue Wave 3.
We assume blue Wave 2 is currently ongoing as a WXY displayed in red here. Where we finished Wave W & X and are working on the red Wave Y which is unfolding as an ABC displayed in orange where we are working or finished orange Wave B in the yellow ABCDE triangle.
For targets areas we get plenty of confluences around that 2.83 USD to the 2.77 USD area where the 1 to 1 FIB ratio at 2.7972 USD sits. We also got a wick low right above at 2.8277 USD which could provide some liquidity for a bounce.
Further support would be at the swing low at 2.7107 USD which sits right in the golden pocket displayed at the green box in our blue Wave 2 support area.
And in case we go deep into the support area we have a 1.618 FIB at 2.5447 USD which is in confluence with the 0.786 FIB at 2.5587 USD of our blue Wave 2 support area. That would be a rather deep retracement and we don't want to see a sustained break of the support area.
Be aware that a break above the yellow line at 3.2031 USD would be the first indication that we might be going up more directly up or that yellow Wave C of the Elliott Wave Triangle in orange Wave B is resetting. A break above the yellow A Wave at 3.2854 USD would invalide the Elliott Wave Triangle in the yellow ABCDE and indicate that the price is following another count or breaking out to the upside.
Thanks for reading.
NO FINANCIAL ADVICE.

Next price in the range of 4.5 ???As you can see, Ripple has formed a channel with an upward slope in the daily timeframe, and this decline caused the candle to hit the bottom of the channel exactly.
Considering the trend inside the channel, the next price should be in the range of 4.5. After reaching this price, if the channel is broken, unexpected prices should be expected.
If the trend remains inside the channel, it will reach higher prices according to the same slope created.

XRP Remains Fragile Below ResistanceXRP Remains Fragile Below Resistance
In a recent analysis, we noted that XRP has reached its first target and is currently testing the reversal zone.
While this bearish scenario might not be appealing and good for you, it's crucial to acknowledge that it remains a possibility as long as the price stays below resistance.
If uncertainty continues to surround the crypto market, XRP could easily reach its first and second targets.
It's also worth noting that President Trump postponed the tariff increase, and a similar approach could be taken with cryptocurrencies. If that happens the crypto market may crash easily.
You can find more details in the chart.
Thank you!

XRP 1HR ANALYSIS 🚨 XRP 1-Hour Analysis 🚨
Here’s what we’re watching:
📈 Upside Targets:
• TP1: 3.39
• TP2: 3.67
📉 Downside Targets:
• TP1: 2.88
• TP2: 2.60
So we have to watch out for level. If XRP stays below 3.11- 3.07 then you can target downside targets and if above then you can target above levels mentioned as TP(take profit)
Keep an eye on key levels and trade smart! 💹

XRP ready to next stepIn this chart, a harmonic pattern called the “Butterfly Pattern” is visible, with key points labeled as X, A, B, C, and D. Here’s a brief explanation of the components:
1. Harmonic Pattern:
• The pattern is based on specific Fibonacci ratios. The levels indicate that the price may potentially reverse upward from point D.
• Point D is typically where the price is expected to react.
2. MACD:
• The MACD indicator at the bottom shows momentum changes. The blue and orange lines moving downward indicate decreasing buying power.
3. RSI:
• The RSI indicator is in oversold territory (below 30), suggesting a potential reversal in the price.
4. Price Target:
• The blue arrow and the yellow line at the top indicate a potential price target (4.3081). This target is based on technical analysis and might represent a future resistance level.

XRP USDT💰 CRYPTOCAP:XRP USDT
#XRP Strong breakout confirmed above key resistance!
The retest of $2.7162 is holding, signaling bullish continuation.
🎯 Target: $4.8338

XRP similar to BTCEither something completed or this was just a wave 1 of the next incoming sequence of a motive wave in Elliott Wave theory.
I dislike calling truncations but here we have an extended 3rd wave and a deep supposed 4th wave which gave almost equal size within the 1st and 5th wave.
