XRPETH trade ideas


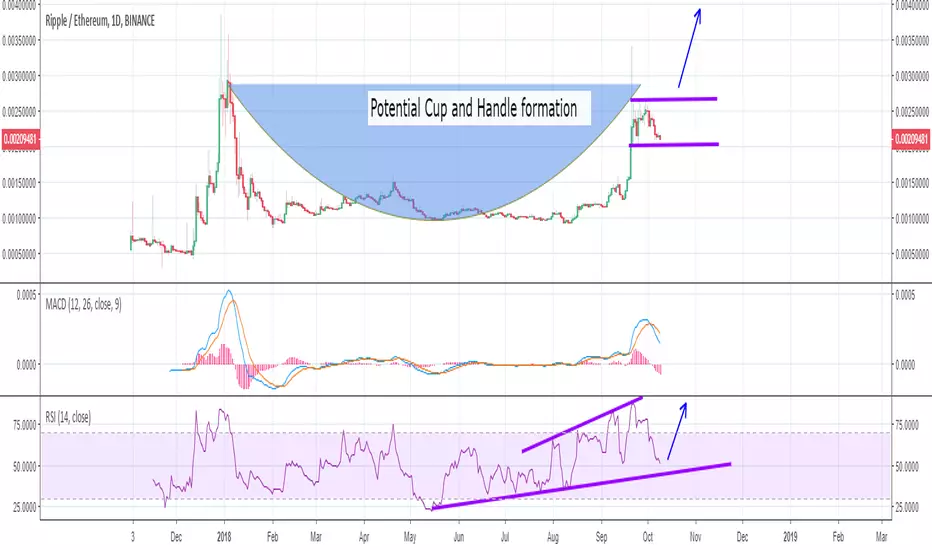
XRP ETH A Cup and Handle to form?It’s interesting that both XRPUSD and XRPETH look to be in the process of creating a bull flag that will drive Ripple much higher.
While XrpUSD has substantially broken it’s down ward trend line, XRPETH hit it's ATH area again and could be in the process of potentially creating a massive cup and handle.
All though MACD has turned down, we are still in positive territory. Notice how RSI has been in this upward channel and is approaching this trend line, similar to this .002 support area we are in.
If this .002 level holds and head towards the .0027-.003 area, and eventually get a break, we will be going much higher.
Something to keep in mind.
Happy Hodling,
-Sherem


$XRP / $ETH Short-Term Chart Random DrawingI don't know with XRP right now, just random thought for short term. Ey!


XRP taking over ETH No.2 position
XRP bullish run continues as expected. I have a feeling it will soon take over ETH No.2 position. Check XRP analysis posted before for major resistance levels.

There is a possibility for the beginning of uptrend in XRPETH Technical analysis:
.RIPPLE/ETHEREUM is in a range bound and the beginning of uptrend is expected.
. The price is below the 21-Day WEMA which acts as a dynamic resistance.
. The RSI is at 46.
. While the price downtrend in the Daily chart is not broken, bearish wave in price would continue.
Trading suggestion:
. There is still a possibility of temporary retracement to suggested support zone (0.000979 to 0.000915). if so, traders can set orders based on Price Action and expect to reach short-term targets.
Beginning of entry zone (0.000979)
Ending of entry zone (0.000915)
Entry signal:
Signal to enter the market occurs when the price comes to "Buy zone" then forms one of the reversal patterns, whether "Bullish Engulfing" , "Hammer" or "Valley" in other words,
NO entry signal when the price comes to the zone BUT after any of reversal patterns is formed in the zone.
To learn more about "Entry signal" and the special version of our "Price Action" strategy FOLLOW our lessons:
Take Profits:
TP1= @ 0.001080
TP2= @ 0.001130
TP3= @ 0.001172
TP4= @ 0.001321
TP5= @ 0.001555
TP6= @ 0.002349
TP7= @ 0.003208
TP8= @ 0.003850
TP9= Free


XRPETH - trade in volumes zoneFriends, good afternoon. Today the day began without major market movements. Analysts of our company and I chose the safest trading assets and decided to share one of the ideas with you. There are a lot of money in the market, so everyone will have enough.
We decided to pay attention to the crypto-currency pair XRPETH .
Movement on it is relatively calm, against a background of calm and moderate market. Therefore, trading from the levels should all bring the expected result.
As we see, the price rested in the lower zone of resistance and it certainly does not want to pierce it. There are no volumes in that zone, so it is better to trade in a high-volume zone. Therefore, we believe that the price, within a few days, will go to 0.00106651. Stop can be set in the zone 0.00097859. A trip to the stop should not be expected, so we hope for a good profit.
If you want to receive more profitable bargainings, welcome to the site cdlcrypto.com. All registered users receive the freshest trading ideas from analysts of our company :)
All good day and profitable trade!


XRPETH — BUYWith Uphold listing XRP on May 24, it is a buy. Price is at the lower point of the consolidation range formed over the past week. Buy now, sell at $1.80. Or $3.00

Got to have the Ripple to get the Nipple!In my opinion this is a STRONG buy on XRPETH within next couple days this could really explode.
DYOR and please give me a like if you agree. Please give me feedback if i've done this chart incorrect :)

XRPETHIn my opinion, if price can break the down trend line if RSI and OBV approve this breaking. We also see positive divergence in the RSI indicator which is good sign for increase the price of XRP/ETH

Will we climb the rope and ring the bell?We are trending towards the formation of the bottom of the handle and can expect to go up in the short term. Many speculations and positive news could also bring us back up to resistance sooner than expected, to then draw us back down to the bottom of the handle. Keep an eye out for a break in resistance, this could potentially bring us to $1 land and bring us in line within ringing distance. Time to hit the market for a new pair of sleds and vests, we're in for a ride.


XRP almost thereLooks like ripple is about to complete a ABC correction and will be looking at the 100 day moving average as support to complete the formation then im looking for a bullish impulse wave up. This coin has a lot of controversy in the crypto community but nonetheless it is a fundamentally solid coin and should continue to gain strength as this bull run continues to heat up.
Thank you for viewing and i would love to hear back from some of you. As always i have to say this is not financial advice but merely my opinion on what i see on the charts so DYOR and happy trading

$XRP/ETH 2 inverse head and shoulder formations? Looks like 2 Inverse Head and Should formations on $XRP/ETH. Correct me if wrong.

XRP-ETH Temporary Bottom then ReversalIt's 4Hrs chart and 3 Candle are bottomed, That means 12Hrs. XRP-ETH market was Silent.
In another view If you see Temporary Bottom Then Remember It's going Reversal soon and you can take Approximate 40% Profit of your Investment.
If you'll tracked any Temporary Bottom then Please Private Message me.
Thank you

XRP/ETH TRIANGLEin abssence of divergence after a little fall we will hope that it will increase.
caution : do not base your tradings on my analysis.

