XRP - 1D - Another view of last idea - Descending ChanelThis is an update of the last idea, I forgot to draw the was of the descending chanel sorry.
Lines are very paralel.
The 2th of March, we'll have to check if the price break the chanel, if it's not it can be a short opportunity to the bottom.
XRPEUR trade ideas

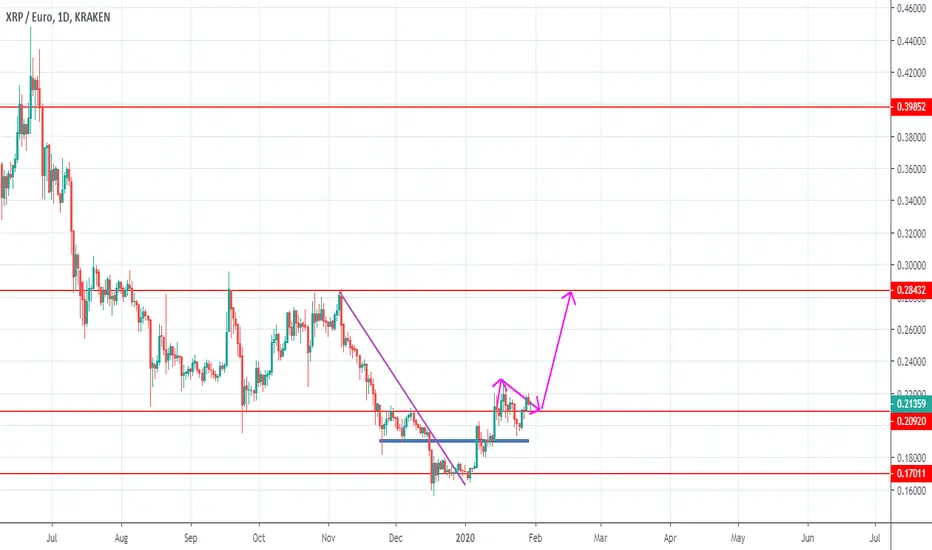
XRP - 1D - Back to the bottom?XRP is falling again to the bottom.
It will be directly like ABC scheme or maybe it will take longer.
A lot of traders are predicting a moon within 2, 5 or even 30 days. We are in a big descending triangle for two years right now. We will not break it so easily before the end. As the end of this triangle will occur the lowest bottom, it will be a good opportunity to think about it again.
Right now, the price is falling, why not to short?

XRP- WE OPEN LONG POSITION - ENJOY WE OPEN NOW LONG POSITION ON STRONG SUPPORT LEVEL... WITH STOP LOSS AT 0.23798 ( -2,08% ) ENJOY
OPEN SHORT POSITION and CLOSE PART OF IT in line with the Targets (SEE CHART)
PLEASE GIVE A VALUE AT OUR WORK HITTING THE LIKE BUTTON THANK YOU, GUYS! ENJOY

XRP - ELLIOTT WAVES (POSSIBLY SECOND ROUND) - ENJOY
IF THE PRICE WILL BREAK THE TREND LINE OUT THE CHANGES OF A SECOND SEQUENTIAL OF ELLIOTT WAVES WILL BE VERY HIGH.
SEE BELOW THE PREVIOUS RELATED IDEA WITH 4 GAIN TARGET ✅✅✅✅💪🏻
LET'S SEE WHAT WILL HAPPEN!
PLEASE HIT THE LIKE BUTTON IF YOU AGREE WITH OUR IDEA... ENJOY! 👍

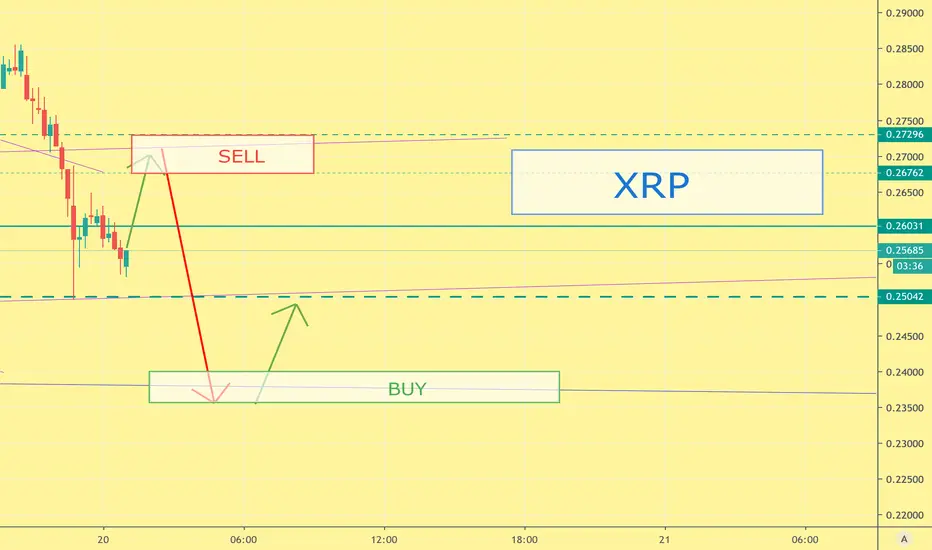
XRP - A STRONG FIRST IMPULSE CALLS ALWAYS A SECOND ONE - ENJOYA STRONG FIRST IMPULSE CALLS ALWAYS A SECOND ONE ... That's why we are considering to follow the Fibonacci's level to find out the SELL ZONE and BUY ZONE
PLEASE GIVE A VALUE AT OUR WORK HITTING THE LIKE BUTTON THANK YOU, GUYS! ENJOY
XRP - WE OPEN NOW LONG POSITION - ENJOYWE OPEN LONG POSITION and CLOSE PART OF IT in line with the Targets (SEE CHART)
VOTE HOW DO YOU AGREE WITH THIS IDEA FROM 1️⃣ TO 1️⃣0️⃣ ?
PLEASE GIVE A VALUE TO OUR WORK HITTING LIKE BUTTON THANK YOU, GUYS! ENJOY

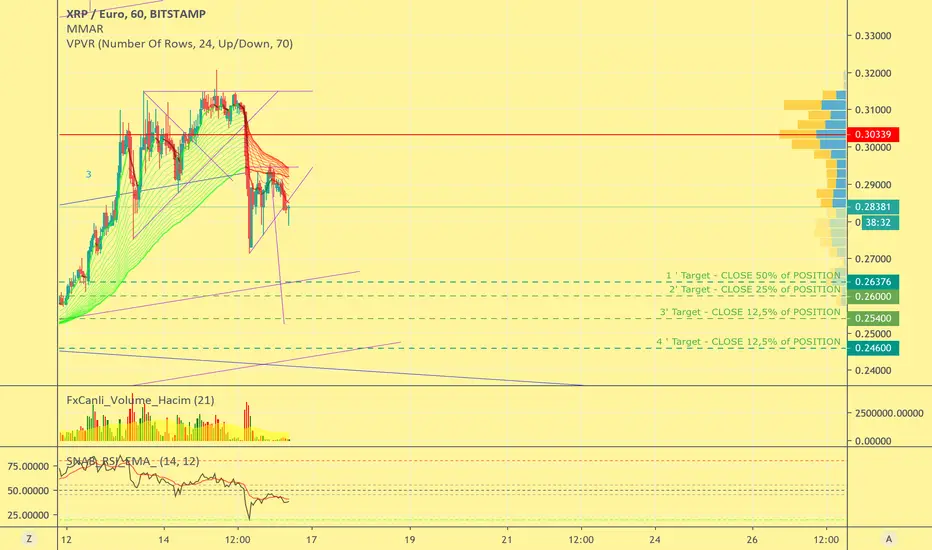
XRP - NOW OPEN SHORT POSITION. ENJOYOPEN SHORT POSITION and CLOSE PART OF IT in line with the Targets (SEE CHART)
PLEASE GIVE A VALUE AT OUR WORK HITTING THE LIKE BUTTON THANK YOU, GUYS! ENJOY

My resistance levels if Ripple continues its breakoutThere is no bullish pattern confirmation, nor supper bullish volume movement...
But, there is a rapid moving RSI, increasing positive volume and an big breakout in its bearish triangle to the upside.
You can see how I confirmed that by my previous idea:
However there can be more volume. I don't think it will get loads of attention now immediately, but it will come.
In my eyes it is very healthy to have a correction towards 0.252 but anything much below that with a weekly close will call a fakeout imo.
Also on daily chart the 50EMA is very close to crossing the 200EMA...
My updates such as entries and targets come on my other idea as mentioned.

XRP COULD skyrocket if it breaks out of triangular formationHuge bearish triangle seen since 2018.
Ripple been in this formation for very long and it should go lower as if it's the highest probability.
But since it is starting to flatten out and coming closer it could potentially go trough it.
If there is enough volume this could be a monster breakout imo.
I'm super curious to how this turns out!


XRP - 1W - Long did you say?On short term, I do not see XRP long on my chart.
Maybe it's because I use Kraken based chart but I see we are still under the big resistance of the pink triangle.
And all the Stochastic / RSI are overbought in all chart. Only 1W chart is ok with these indicators, but 1W chart is for long term trade...
I see hundred of charts only based with horizontal lines, no indicators, no trend lines and can tell this is long, we are going to the next resistance. I don't really get it.

XRPEUR is about to boom even moreKRAKEN:XRPEUR on the daily chart
- Beautiful bullish candles, wicks rejecting the lower price
- Nice support by the EMA10
- EMA10/20 fanning out in the correct order
- MA200 about to be crossed
- Bullish MACD
- Strong RSI

XRP - 1D - Decsending triangle limitHello,
Relating to the last chart, we are approaching the pink line of the descending triangle.
Looking at the stochastic : Overbought on 1H, 2H, 6H, 1D, 2D, 3D chart.
Looking at the RSI : Overbought on 1H, 2H, 6H, 1D, 2D, 3D chart.
Looking at the EMA : We see that the pink line crossing can correspond to a golden cross, that could validate the importance of this triangle.
In my opinion, I'll try a short trade for next move with the bottom of the triangle as target. Then we have to make an strong analysis to understand what will happen next.
There is a chance that the price will beat right now the descending triangle but technical indicators are showing the contrary. Don't forget the to put safety limits.

XRP - 1D - Beware of the hypeI've seen a lot fo charts based on the crossing of the blue line of this chart.
I'm not confident that the 2 years triangle is made with the blue line, but the pink line.
Indicators are showing a Stochastic near to 100 and a double high with the same indicator.
I should target something like 0.255€ - 0.26€ and sell at this price. Then I'll try to short with pink descending bottom as target.
Then the big triangle could be almost finished and we'll see what will be the big move at this moment.


XRP - 1D - Let's test the big ResistanceXRP got blocked today by the small blue and crossed resistance that is acting as a pump support for testing the big one in pink.
Stochastic shows overbought and I'm thinking about its future scenario untill the good one.
On the 4h chart stock is oversold, that means on short term we will continue to climb.
A good target should be 0.26€. Then if we don't cross the pink line, we can think about shorting to the pink bottom.
And then we can prepare for a big trend change as the pink triangle is soon finished.


XRP - CUP AND HANDLE PATTERN - READY TO BUY - ENJOYPLEASE, CLICK LIKE TO SUPPORT OUR WORK
THANKS AND ENJOY

XRP - 1D - About the current movesWe have broken the mini descending triangle in blue, but we are still in the big one in pink.
On the 1W chart we can see the Stochastic is still very low (oversold) so we can imagine the price reaching the pink resistance in the following days/week.
The EMA lines are still showing that we are not near a golden at all.
So, after a quick visit to the resistance, I'd see come back to the support again before the end of the pink triangle... And then, we'll read the indicators and charts again!

XRP short term bullish Elliott wave counteverything's in the chart.. I like XRPEUR better for charting..

XRP Court Date January 15th @ 9am California (GMT-8)I'll try to look into this more and come up with something hopefully before the court date. Let me know what you think in the comments!!!
