XRP/EUR - Daily - At an interesting spotTrade Alert Continue observing XRP/EUR carefully, as it balances slightly below its medium-term tentative downside resistance resistance line taken from the high of September 30th. At the same time, the crypto is balancing around its 200 EMA. For now, we remain cautiously-bullish, but before we could examine higher area, we would need to see a break of that downside line first. Please see the chart for details. Don't forget your stop-loss. by JFD_Research3
Taking some money out of XRP hereI think the euphoria is dangerous and looking at history it often had a smackdown. So I take some money out of crypto to get it back in at a cheaper pointby ZenergyUpdated 4
Next bull run 8-75€ for XRP. The next bull run will bring the XRP price to 8-75€. The coming weeks are very important, as we are currently just above the yellow trend line and about to close the big wedge. We are trading in tight price range and might break out soon. See that chart for more info.Longby MakeThatMoneyWorkUpdated 1124
Bullish scenario in XRPwhat i see in xrp is, that is about to finish wave 2 in a bullish trend on the ( daily-weekly). and it has formed a BIG descending triangle, if this scenario plays out perfectly, we will get a last touch on the 7 months old support. if that plays out. i´m pretty sure we will be looking at prices around 0.35-0.50 in ending off may. (maybye april) if you pair the news about xrp there have been published in the last half off year. AND keep in mind that we are about to jump into the 2 quarter off this year. im pretty confident to say, that we will see a spike in the price, in the nearest future. BUT i will not call it a bull-run yet! i think we wil have to look at prices around 0.30-0.28 again. and THEN i will concider to call the BULL-RUN. but for now. I will be looking for longs around 1-5 april in the 0.26500-0.25900 ( maybye before) if you are using stop-losses it will be in the 0.24880 zone. it could give a great R/R 1:3 to target 1. 1 target = 0.29700-0.30700 2 target = 0.40500-0.45000 AND always remember to trade safe and make your own descisions and TA´S good trading here from ;) Longby hayolo3
XRPEUR BUY TP_0.3007_7.40%_0.0207pips_SL_0.2653_5.22%_0.0146pipsXRPEUR BUY TP_0.3007_7.40%_0.0207pips_SL_0.2653_5.22%_0.0146pipsShortby UnknownUnicorn2283113Updated 0
Uptrend coming for XRP? Higher lows seem to be established.Uptrend coming for XRP? Higher lows seem to be established. Longby MakeThatMoneyWorkUpdated 118
XRP 4% Play multiple timesIf we keep going in the channel this might be what to expect :)by gunnelof0
XRPEverybody is waiting for XRO to break out of the giant triangle but It already has in XRPvsEURO! Any thoughts? I hope by April to make a MAJOR move. Stay strong, HODL and nothing but the best :)Longby Gi7vis4
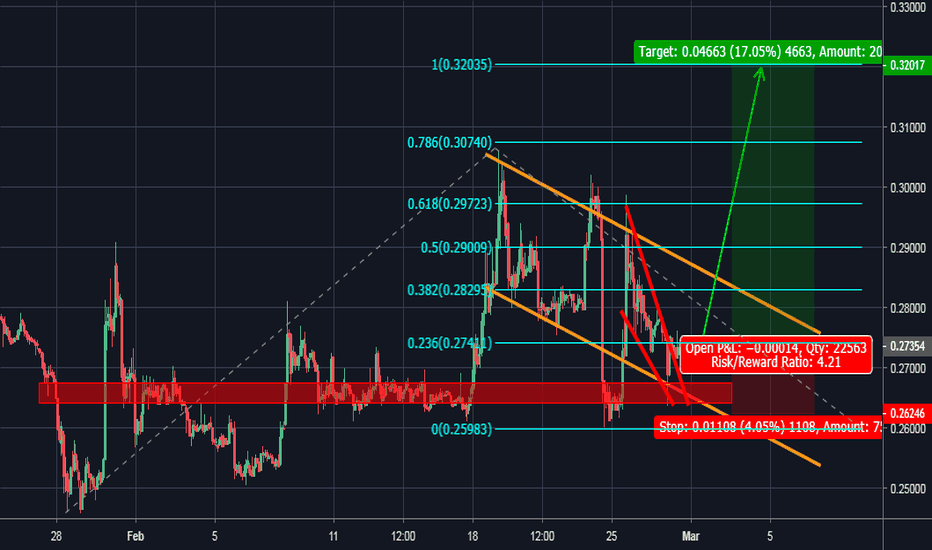
XRP/EUR buy idea H2 RR=4 We have a breakout of falling wedge and a bounce on a previous key level (shown in red) and bottom of falling parallel channel wich is a figure of continuation for upward movements , I'm expecting trend to be bullish for the next few day . Potential target : the 0.32 euro (the 100% trend based fib extension level ).For a buy at 0.27354 , TP at 0.32 and SL at 0.26246 you get a RR ratio of 4 .Longby slim71
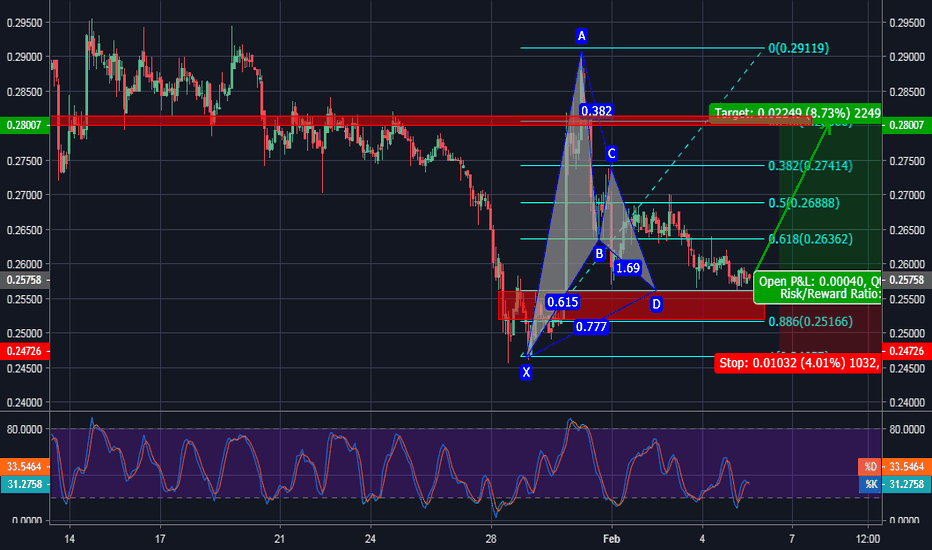
XRPEUR buy opprtunity H2Stochastic indicator shows that we are in oversold zone ,Price formed a bullish gartley pattern at previous support level it may go up test previous key zones at least the last swing high . For a buy at actual price 0.25758 , SL at 0.24726 and TP at 0.28 you get a RR ratio of 2Longby slim70
ending diagonalexpect to beak the december 25th top for the wave D then drop for capitulation to finish wave Eby Yohisa2
XRPEURHi all, This is just a quick update on XRPEUR. What an amazing previous 1h candle! Good volume, no upper or lower shadow and most important: green! XRPEUR pair seems to have created a double bottom with the low around 15 december 2018. Thereby it exited from the falling wedge and made its way back into the big green triangle. If price does not make a sudden and unexpected U-turn (or BTC does something weird), I would expect it to test the upper descending green trendline (red box) in the near future. ---------------------- Comments are welcome. Please like & follow for more TA. DISCLAIMER: This is neither a trading nor a financial advice. You are responsible for your own actions so do your own research. by c_c2
Xrp important update The most important day from the year 1 big line decide the future of the xrp price Longby sicaadrian113
XRP - Symmetrical Triangle continuation or reversal ?stockcharts.com The symmetrical triangle, which can also be referred to as a coil, usually forms during a trend as a continuation pattern. The pattern contains at least two lower highs and two higher lows. When these points are connected, the lines converge as they are extended and the symmetrical triangle takes shape. You could also think of it as a contracting wedge, wide at the beginning and narrowing over time. While there are instances when symmetrical triangles mark important trend reversals, they more often mark a continuation of the current trend. Regardless of the nature of the pattern, continuation or reversal, the direction of the next major move can only be determined after a valid breakout. We will examine each part of the symmetrical triangle individually, and then provide an example with Conseco. Trend: In order to qualify as a continuation pattern, an established trend should exist. The trend should be at least a few months old and the symmetrical triangle marks a consolidation period before continuing after the breakout. Four (4) Points: At least 2 points are required to form a trend line and 2 trend lines are required to form a symmetrical triangle. Therefore, a minimum of 4 points are required to begin considering a formation as a symmetrical triangle. The second high (2) should be lower than the first (1) and the upper line should slope down. The second low (2) should be higher than the first (1) and the lower line should slope up. Ideally, the pattern will form with 6 points (3 on each side) before a breakout occurs. Volume: As the symmetrical triangle extends and the trading range contracts, volume should start to diminish. This refers to the quiet before the storm, or the tightening consolidation before the breakout. Duration: The symmetrical triangle can extend for a few weeks or many months. If the pattern is less than 3 weeks, it is usually considered a pennant. Typically, the time duration is about 3 months. Breakout Timeframe: The ideal breakout point occurs 1/2 to 3/4 of the way through the pattern's development or time-span. The time-span of the pattern can be measured from the apex (convergence of upper and lower lines) back to the beginning of the lower trend line (base). A break before the 1/2 way point might be premature and a break too close to the apex may be insignificant. After all, as the apex approaches, a breakout must occur sometime. Breakout Direction: The future direction of the breakout can only be determined after the break has occurred. Sounds obvious enough, but attempting to guess the direction of the breakout can be dangerous. Even though a continuation pattern is supposed to breakout in the direction of the long-term trend, this is not always the case. Breakout Confirmation: For a break to be considered valid, it should be on a closing basis. Some traders apply a price (3% break) or time (sustained for 3 days) filter to confirm validity. The breakout should occur with an expansion in volume, especially on upside breakouts. Return to Apex: After the breakout (up or down), the apex can turn into future support or resistance. The price sometimes returns to the apex or a support/resistance level around the breakout before resuming in the direction of the breakout. Price Target: There are two methods to estimate the extent of the move after the breakout. First, the widest distance of the symmetrical triangle can be measured and applied to the breakout point. Second, a trend line can be drawn parallel to the pattern's trend line that slopes (up or down) in the direction of the break. The extension of this line will mark a potential breakout target.by NoobOfTheMonthUpdated 11
GOD ARE YOU THERE?"O desenvolvedor Ryan Fugger, o empresário Chris Larsen e o programador Jed McCaleb lançaram a empresa de software Ripple em 2012 e sua moeda digital, XRP, é vista por alguns membros da indústria como o sucessor lógico do Bitcoin. O New York Times descreveu a Ripple como "um cruzamento entre a Western Union e uma troca de moeda sem as altas taxas" porque não é apenas uma moeda, mas também um sistema no qual qualquer moeda, incluindo bitcoin, pode ser negociada. "A Ripple conecta bancos, provedores de pagamento, trocas de ativos digitais e empresas através da RippleNet para fornecer uma experiência sem fricção para enviar dinheiro globalmente", explicaram os criadores. A Ripple licenciou a sua tecnologia blockchain a mais de 100 bancos. Existem quase 40 bilhões de XRP em circulação, para um máximo de 100 bilhões que podem ser criados."Longby NunoBelemFX0
Xrp update the big move coming sooni belive Xrp will go to the moon very soon target 1 euro Long00:36by sicaadrian5
Unintentional ObservationSo I had this gigantic triangle, which every trader has and I dont consider myself a genius, but I noticed something interesting. Ever since we broke out of it hard on Christmas Eve, it has became some sort of a resistance. I am curious how it will play out. I cannot tell you a buy in moment or what direction it will go. I believe up but we will see. If it would drop to 0.27 it would be a perfect moment to buy but I think I would FOMO in at 0.30. As always, my 2 cents, no crystal ball :) Stay positive, take profits and plan accordingly!Longby Gi7vis2
xrp personal updatei belive xrp in short time will go down but in ..10..15 days from now will see big moves down or up01:44by sicaadrian2