Ripple still at risk Resistence line still not broken wait untilWe can see that Ripple is still in a critical zone
I would consider buying it if it will substantially breaks the resistence, otherwise sell or keep waiting.
XRPEUR trade ideas

Buy, Ripple/Euro 5euro Next?Ripple is on the price corrections right now, this can be a positive signal to buy te dip.

Trend analysis, channel formed Though I'd share this analysis of where I think XRP is headed. I plan to buy and sell along this trend line to hopefully increase my XRP. So far it's held strongly to this channel, however I believe that it will encounter support at around 1.55. This is my first analysis.


XRP/EUR buy from 1.60 targets 3.50 then 4.50 then 7.20 EuroXRP has been retracing a bit after a nice bullish run.
For a change I have made this XRP/EUR chart because XRP gets traded against more and more fiat pairs, as well as other cryptocurrencies.
Maybe also my European XRP followers are waiting for this update. As everybody normally shares the USD or BTC chart of XRP.
We can see a clear retest of 1.60 from where new buying can come in.
Fibonacci shows me the way towards extension levels 23.6 and 61.8 and 161.8 which through history are very accurate.
This lines up with the prices of 3.50 Euro, 4.50 Euro then up towards 7.20 Euro for the next legged move.
Like this you will see XRP keep on going making new highs.

#XRPEUR has been building up a solid uptrend channelHello all,
According to XRP prior moves, this is one of the cryptocurrency to pay close attention to this year. We can see this crypto has been building a solid uptrend channel against the euro and it's likely to break the 4H linear resistance.
Once the linear resistance is gone the next ceiling can be expected at the channel resistance again. That area shows perfect confluence with the measured move as you can see. Before we call yellow bananas the swing high needs to be broken.
Most of you traders know we don't care about fundamentals and in the crypto world this is even more important. It's all about coin strength, team, potential and supply vs. demand.
Good luck!

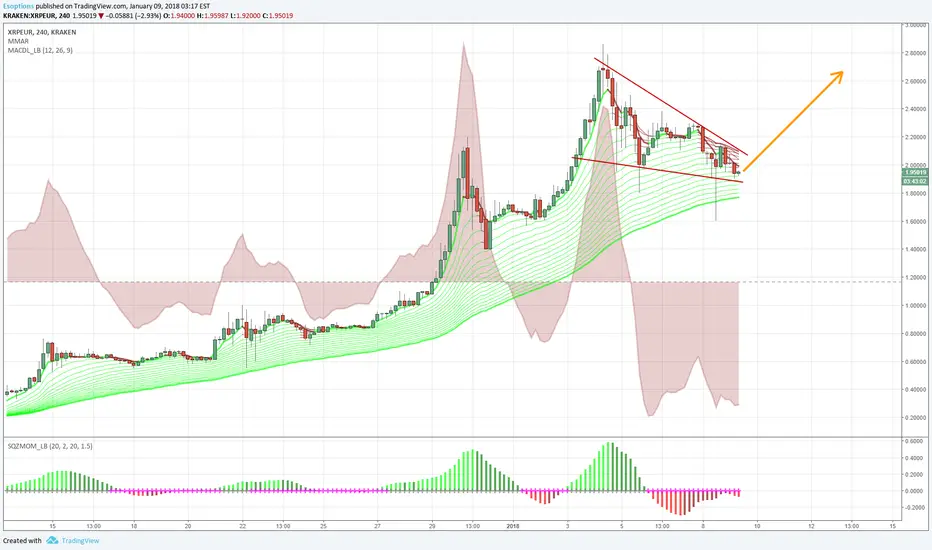
Bull Flag or testing of the past trend line.Big confusion today.
One: A Trendline was broken and XRP crashed. XRP could go back to the broken trendline and fall again.
Second: XRP is forming a bullish Flag.


XRP search support, Trend direction HODL?XRP is testing support limits right now, will the trend continue to new heights? I will take a close eye on XRP this month, waiting for coinbase to add the altcoin.

Elliott Waves ForecastJust an attempt to count Elliott Waves for XRPEUR from 2017-12-12 to 2018-01-06.
If wave 5 of the minor wave (the bold cyan one here) is correct a minor correction scheme (purple ABC) should follow before we move up again with the next impulse wave (purple 12345, which time range I made shorter in order to make sure you can recognize the wave counting better).

Is XRP at it again ?Anyone who followed XRP since a couple of month can recognised that pattern and know how it ends up... Hopefully that symmetrical triangle will show us another nice bull run.
Short term XRP trade. Target 3.3 EUR (thats passed 4 USD by a couple of cents) , which has already been reached last week on a couple of Asian Exchanges.

textbook leading indicatorI'm a newbie, I thought that this would be of interest to like-minded students.
The RSI indicator here showed a textbook bearish divergence; it could have saved anybody who spotted it a 25% loss yesterday.

XRP/EUR - Long (4h)After a short correction we a straight in the long channel....now we are again in buy zones for next long move

Massive BULL flag on XRP!XRP is bulding a massive BULL flag pattern. If this break, i expect a strong bounce to 4.5 usd lvl. or around 4€.
(chart is in EUR)
Br

XRP will likely continue rising Everything is in chart.
This is my first TA so feedback is highly appreciated.

XRP could deep moreI love XRP an i am hodling it for a long time now. I tkink that we can see further correction after next small wave up.
I thinkig to close all my long positions on that jump.
Be careful!
Br


Optimistic Repeating PatternXRP is still strong as no fundamental information has changed (technologically useful for banks, used by credit companies, rumors about entering Coinbase).
As we have seen in the previous movements the correction went between 61,8 - 50 % fibonacci. Then a little consolidation sidewards before the next upward movement begins.
In my chart you can see the fibonacci retracement levels and time which I made for the previous and the current movement. According to this we will aim for a correction price range from 2,10 to 2,40 €, thats your dip (blue).
I guess we will see another consolidation sideward movement for tomorrow before it has to be decided in which direction it will move on, which will be up to around 3,25 € according to the overall trend, thats your target (green top).
Nevertheless, do not forget to set a stop loss limit below the green support or trend line. If this support breaks and shortly afterwars the bottom upward trend line breaks, we will see a much further movement downwards to 1,63 or even 0,83 €.

XRP @ kraken, buy limit & Waiting for coinbase 2 join Ripple!I will expact a big gain before februari.


XRP Breaking Resistance 2 - Swing Trading Looks like could be a good exit point to make 10-15% by re-entering.

