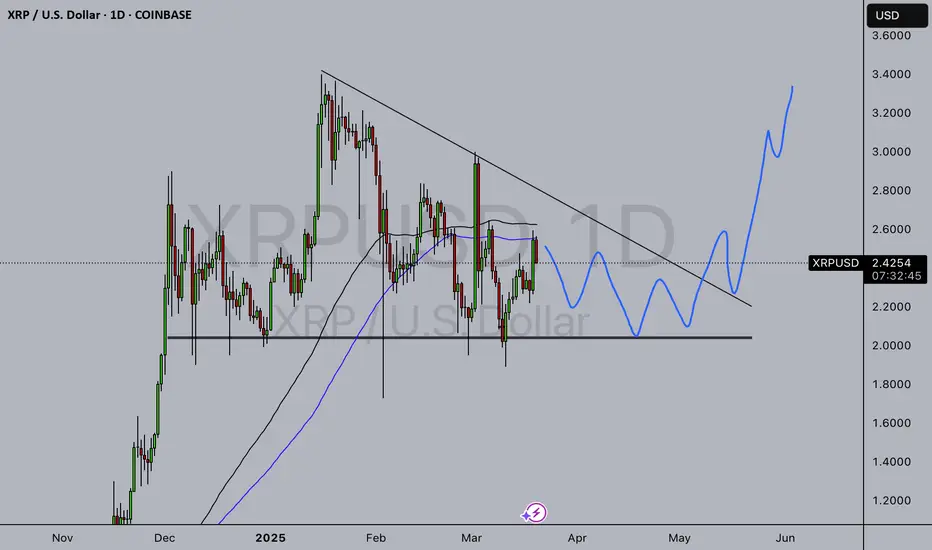
still at least a month awayI believe we are still at least a month from breaking out of this big ole wedge we are stuck in. The news and rumors just keep bumping us around inside of it for now. So for now I'm following the charts, not the news, and trying to be patient.
XRPUSD.P trade ideas

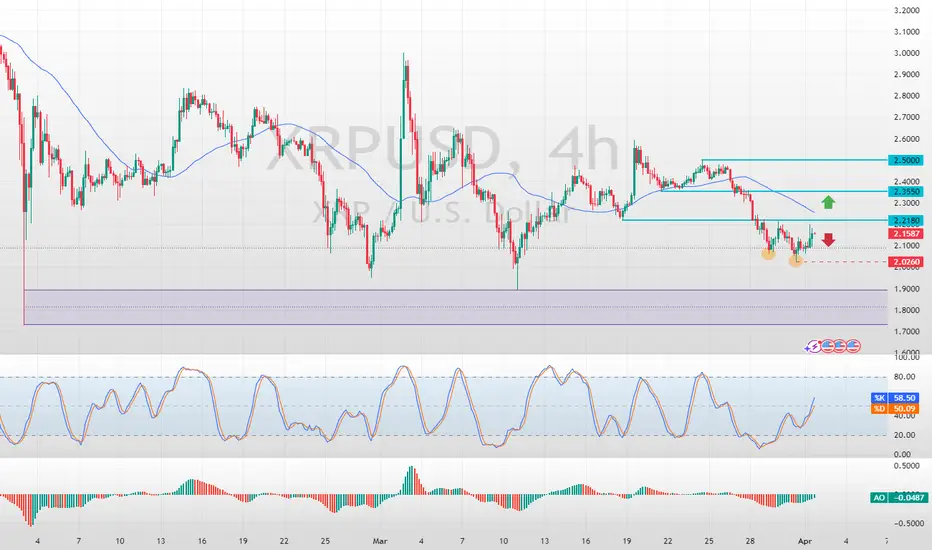
"XRP Facing Downtrend – Key Support Levels to Watch"XRP is trading within a descending channel, struggling to break above key resistance levels. The price has rejected the moving average and is showing potential downside movement. Fibonacci retracement levels highlight key support at $2.31 (0.786 Fib) and $2.02.
If the bearish momentum continues, a retest of the lower trendline may be likely. Can XRP find support and bounce back, or will the downtrend persist? Let us know your thoughts.
#XRP #Ripple #CryptoAnalysis #TechnicalAnalysis #Trading

The trend that is trendyAs you can see since November 24th, 2024 pump, this thing has not stopped trending to the upside. It is majorly super bullish. Don't listen to the naysayers. The chart is the news.
Xrp hasn't just been performing sideways action. It's already telling us exactly the directions It's headed before we go there. Patience 😏

XRP Wave 5 Starting Part 2Hello There,
There is the bullish case in which we bottomed and we are heading higher with a completed sideways combo in the wave 2. Currently we could be starting Wave 3 with a Leading Diagonal in the wave 1.
Probabilities? currently looking at both cases I think the bearish case may have a slight higher probability at the moment to dip in the $1.4 - $1.9 range first before hitting that $10 range.
Either way we have at least one more bullish wave left, so plan according with your holding and risk
GOD BLESS AND TRADE ON
Stay Humble and Hungry

XRP Wins CASE Now with XRP without the SEC case behind them, we should see more bullish pressure. here we can see a triangle present about to break with bullish pressure to be expected in the next few months.
XRP/USD Technical Analysis: Trend Reversal and Key Levels to WatThe overall price direction shows a transition from a downtrend to an uptrend, which can be broken down into 3 phases:
Strong Downtrend: At the beginning of the chart, the price declined sharply, dropping from levels above 2.50 to 1.89708 (lowest point).
Consolidation and Correction Phase: After reaching the low, the price started to consolidate and attempt to form a bottom. Several buy signals (green triangles) appeared at the bottom, indicating a potential reversal.
Clear Uptrend: Starting from the middle of the chart, the price began forming higher highs and higher lows, with moving averages crossing upwards, signaling a positive trend continuation.
The main reason for identifying the trend as currently bullish is:
Price recovery to 2.50 after forming a bottom at 1.89.
Moving averages crossing upward.
Increased buying momentum, as seen in technical indicators.
Bullish Indicators
Breakout above previous resistance at 2.30, allowing price to rally towards 2.50.
Moving Averages (MAs) show a positive trend, with price trading above the blue and red lines, indicating continued upward momentum.
Buy signals (green triangles) at lows, suggesting strong buying pressure.
Relative Strength Index (RSI) surpassing 60, indicating bullish momentum.
Increased trading volume during upward moves, confirming buying strength.
Bearish Indicators
Sell signals (red triangles) at resistance levels, which may indicate a price rejection or strong resistance around 2.50 - 2.52.
Price approaching a key resistance at 2.52, where it might struggle to break through without additional momentum.
RSI approaching overbought territory (near 80), which could signal a potential pullback.
High price volatility with a sudden spike, which may lead to short-term profit-taking.
Conclusion
Overall Trend: Bullish after breaking out of the consolidation phase.
Potential Upside Targets: If the price breaks 2.52, it could target 2.60 - 2.70.
Support Levels: 2.30, followed by 2.10 (in case of a pullback).
Resistance Levels: 2.52, then 2.60.
Expected Scenario: As long as price holds above 2.30, the bullish trend remains intact. However, if 2.52 is rejected, a slight pullback may occur before resuming the uptrend.

XRPUSD: Buying CandleGreat buying opportunity on XRPUSD as you can see on the chart on a fifteen (15) minute time frame.

For those of you who bought XRP...I've known about COINBASE:XRPUSD for over a decade now. Time has brought tons of rumors, tons of hype, and tons of mistakes still being made by those new and experienced alike. For those of you holding strong pre $1.00, I commend you. For those of you who are bought high and are now riding the emotional roller coaster, consider these 3 things before you make a decision.
1. We are DIRECTLY in the middle of the range
Over 3 months of consolidation has taken place. With a high of 3.40 and a low of 1.70, this is a range for advanced traders. If you bought around 2.00 or under, Congrats! even though you didn't get in pre $1.00, there are alot of Big buyers that have been scooping up XRP at the 2.00 level.
For those of you that Bought 2.50 and above.
Ask yourself why you purchased XRP?
I ask you; Did you buy XRP to trade? or to invest? No they are not the same thing. Investing is long term, 3-5 years+. Trading is dealing with much shorter time windows, even if you are swing trading, Trading is Trading, and this takes a different skill set and mindset. so if you are investing, be happy that XRP is lower in price. if big money is Buying at 2.00, there is nothing stopping you from doing the same. If you are a beginner trader, consider our last point.
Buy with Buyers, Sell with Sellers
Sounds simple right? Here is something you may not know. Liquidity is what moves markets. If you have 100million that you have to invest for your clients in XRP, do you slap the market button? Absolutely not, in fact, you want to make yourself as small looking as possible. Why? YOU NEED PEOPLE TO SELL INTO YOU. Big firms (unless through dark pools) have algorithms make themselves look as small as possible, whilst accumulating and distributing shares efficiently. At the end of the day, These are the big players that move the markets big.
Do you need to know this? Not necessarily for the technical side, but for your emotions, your psychology? Yes this is important.
Find the buyers and sellers (I have them marked in my chart), and learn to play alongside them. You will get better pricing, feel great about your positions, and know if it goes against you, you can cut the trade off early and reposition.
Hope you enjoyed, and happy Trading!

XRPUSD H1 Timeframe MARKET analysis to BullishBINANCE:XRPUSDT My Analysis XRP vs US Dollar shows a candlestick chart for XRP, a common tool in financial trading. It highlights support and resistance zones, which are key concepts in technical analysis. Key Points: First we look at the RSI which is hovering around 62.70 indicating an uptrend. On the other hand we look at Support and Resistance.
Strong Support Zone: 2.0000 Price has previously bounced off this level, suggesting buying interest.
Support Zone 2: 2.300 A recent support level, indicating a potential area for price recovery. Strong Resistance Zone: 3.3000 This is a weak strong resistance zone that could see a good chance of breaking above.
We would consider buying
XRPUSD Buy Entry Level:2.5020
TP: 2.5700
TP: 2.7600
TP: 3.0000
SL: 2.3100

* A GAME OF PACIENCE *Yurrr XRPeers,
If you have been following my analysis, you was also prepared yesterday to a possible sellout from all the news we got.
That sellout happen today. If you were watching the market, you saw volume peaking as retail dumped all their XRP at the peak and sellers got in aggressively bringing the price down to the $2.4 range.
As you can see in the chart, I have two possible price targets for this little correction happening so check it out below for explanation.
T1:
- This first target is assuming that yesterday's pump is part of the first impulsive wave of the W3(green).
- If this scenario is correct, I'd expect buyers hold that $2.3 level and prepare for another impulsive wave.
- The price action that XRP is going through right now is favorable to it. There is a clear ABC pattern with wave A having 3 moves, wave B having 3 moves, and the starting of wave C that is expected to have 5 moves to be completed.
T2:
- For the second target, I'm assuming that yesterday's pump broke the consolidation that was happening before and formed a new top for W1.
- If that is the case, price could have a retracement beginning on T1 but a downtrend continuation that will aim at T2.
I would also like to bring your attention to the RSI, where we can see our Higher Lows trendline being tested and could either be broken or held strong depending on what's happening next.
It is still too early to know and I still haven't figured out how to predict the future, but all we really need to do is observe and prepare accordingly.
Let me know what you think!

XRP Bullish to $0.45!XRP still has more bullish momentum left & we can see an ATH towards $0.45!
Now that the XRP settlement has been dropped, there is not much stopping it from moving higher.

$XRP Timeframe: 4h
Waiting for entry points to execute the final impulse wave. The probable scenario is marked on the chart.
#XRP

XRP projection/SEC lawsuit cancelledOn 3/19/2025, SEC (Security Exchange Commission) cancelled their lawsuit against XRP. I examine the potential projection for future value short term. Here is my analysis based on a bullish pendant pattern.


XRPUSD breaking upward from invh&sTarget is $3. Very likely to hit the full target based on the bullish momentum from the sec ripple appeal being ofifcially dropped. Likely to continue upward from there as well but for this current idea I only wanna focus on the inv h&s target. *not financial advice*

XRP SEC CASE WILL BE DROPPEDFellow crypto market betters,
As you are all aware, daddy Brad announced that XRP case will be dropped and the price jumped from the news alone.
I haven't seen any SEC announcements about the price yet, and today we do have some FOMC decisions coming out.
IN MY OPINION:
1) Be careful with the whole "Buy the rumor, sell the news" dumb money thing.
2) Although price looks like it is going towards target 3, it can still go down depending on what news comes out of FOMC.
News makes analysis a little more difficult because the volume and price action are many times just a "synthetic" data. It goes away pretty quick, and the price goes back to where it is supposed to be.
One interesting data that I kinda don't know what to think about it yet is shown in the charts.
- Both XRP and ADA have broken trend resistances in price and RSI. The pump for ADA wasn't as strong as for XRP so there's still indecision, even with the news pump we had today.
At the end of the day, congratulate your XRP supremacist who've been bothering you for the past 4 years for you to buy XRP and remained faithful through the ups and downs this drama took them.

XRP/USD Skyrockets to the MoonXRP/USD Breakout Alert! After consolidating below key resistance around $2.107, XRP has surged to $7.25, hitting a target gain of 7.25x! The price has broken through multiple resistance levels, showing strong bullish momentum. Are we heading for new all-time highs? Let’s discuss!

#XRP FINAL DIP BEFORE NEW ATH?XRP is creating LHs and looks to be heading for a final dip to the long-term upward trendline (purple) which would make this correction complete.
The ideal scenario is that XRP will complete this correction and with bullish momentum will reach a new ATH within the next 2 months, however, let's see how XRP reacts to this critical support first!

XRPIf we're able to break this minor resistance we could retest $2.30 towards end of day.
If we fail to break above the resistance we will likely fall too $2.05 which would be a great buying opportunity long-term.
We are near a bullish rally.

XRP tests Key Resistance Level F enzo F x—Ripple (XRP) has climbed from $2.026 and is currently testing resistance at $2.218. Despite this upward movement, the overall trend remains bearish as the price stays below the 50-period simple moving average on the 4-hour chart.
The nearest support level is $2.026. If XRP/USD drops below this point, the downtrend may strengthen, potentially driving the price toward $1.90 and then $1.80.
FXAN & Heikin Ashi TradeBINANCE:XRPUSD
In this video, I’ll be sharing my analysis of XRPUSD, using FXAN's proprietary algo indicators with my unique Heikin Ashi strategy. I’ll walk you through the reasoning behind my trade setup and highlight key areas where I’m anticipating potential opportunities.
I’m always happy to receive any feedback.
Like, share and comment! ❤️
Thank you for watching my videos! 🙏

day four xrp price prediction date: 3/31/2025XRP could have been in a corrective wave and not just the standard 12345 impulse because the elliott wave rules state that wave four cannot overlap wave one so that leads me to believe that this could be the start of wave one and could lead us to an uptrend on the resistance on the top or even break it
