XRPUSD.P trade ideas

AND THESE LITTLE PIGGIES CRIED WAAH WAAH ALL THE WAY HOMEIf you haven't realized yet or maybe you all cant read properly but your hopes of getting into the crypto reserve are long gone. Not only that but they intend to sell the forfeited and seized digital assets other than Bitcoin to buy more Bitcoin. REJECTED!

XRP/USD – 30-Min Long Trade Setup!📌 🚀📈
🔹 Asset: XRP/USD (Ripple / U.S. Dollar)
🔹 Timeframe: 30-Min Chart
🔹 Setup Type: Bullish Breakout Trade
📌 Trade Plan (Long Position)
✅ Entry Zone: Above 2.53200 (Breakout Confirmation)
✅ Stop-Loss (SL): Below 2.44965 (Invalidation Level)
🎯 Take Profit Targets:
📌 TP1: 2.64795 (First Resistance Level)
📌 TP2: 2.79059 (Extended Bullish Move)
📊 Risk-Reward Ratio Calculation
📉 Risk (SL Distance): 2.53200 - 2.44965 = 0.08235 risk per unit
📈 Reward to TP1: 2.64795 - 2.53200 = 0.11595 (1:1.41 R/R)
📈 Reward to TP2: 2.79059 - 2.53200 = 0.25859 (1:3.14 R/R)
🔍 Technical Analysis & Strategy
📌 Bullish Breakout Formation: Price is breaking out from a symmetrical triangle, confirming strength.
📌 Support Confirmation: Strong support at 2.44965, acting as a demand zone.
📌 Volume Confirmation Needed: Ensure strong buying volume above 2.53200 for momentum.
📌 Momentum Shift Expected: Staying above 2.53200 could push price to 2.64795 and further to 2.79059.
📊 Key Resistance & Support Levels
🟢 2.79059 – Final Target / TP2
🔴 2.64795 – First Resistance / TP1
🟡 2.53200 – Breakout Level / Long Entry
⚪ 2.44965 – Stop-Loss / Support Level
📉 Trade Execution & Risk Management
📊 Volume Confirmation: Look for strong bullish volume above 2.53200 before entering.
📉 Trailing Stop Strategy: Move SL to entry (2.53200) after TP1 (2.64795) is hit.
💰 Partial Profit Booking Strategy:
✔ Take 50% profits at 2.64795, let the rest run toward 2.79059.
✔ Adjust Stop-Loss to Break-even (2.53200) after TP1 is hit.
⚠️ Fake Breakout Risk
❌ If price drops below 2.53200 after breakout, exit early to limit losses.
❌ Wait for strong bullish candle close before entering aggressively.
🚀 Final Thoughts
✔ Bullish Setup – Breakout above 2.53200 signals upside potential.
✔ Momentum Shift Possible – Watch for volume confirmation.
✔ Risk-Reward Ratio – Favorable 1:3.14 R/R to TP2.
💡 Stick to the plan, manage risk, and trade smart! 📈🔥
🔗 Hashtags for Reach & Engagement:
#XRP 🚀 #CryptoTrading 📈 #XRPUSD 📊 #TradingNews 📰 #MarketUpdate 🔥 #Investing 💰 #LongTrade 🏆 #Crypto 📉 #ProfittoPath 🏆 #SwingTrading 🔄 #DayTrading ⚡ #TechnicalAnalysis 📉 #CryptoSignals 📊 #FinancialFreedom 💡 #MarketTrends 📊 #CryptoAlerts 🔔 #TradeSmart 🤓 #Bullish 📈 #RiskManagement ⚠️ #TradingCommunity 🤝 #SmartTrading 💰 #MarketAnalysis 📊 #TrendBreakout 🚀

Entertainment Purposes Only - XRP destiny analysis based on BaZi(For Entertainment Purposes Only – Not Investment Advice. Please Conduct Your Own Research Before Making Any Decisions.)
This is purely for entertainment purposes—Using Deepseek, we generate a BaZi chart based on XRP's birth date and conduct a destiny analysis to predict its future trajectory :)
The concept and code of XRP were first developed by Jed McCaleb (one of Ripple’s co-founders) in 2011, with its initial technical framework established on April 18, 2011. On June 2, 2012, the XRP Ledger was officially launched, marking the birth of XRP as a cryptocurrency. This analysis is based on June 2, 2012, the official launch date of the XRP Ledger.
Deepseek's Analysis of XRP’s Birth Chart
XRP Birth Details:
Date of Birth: June 2, 2012
Lunar Calendar: April 13, 2012 (Year of the Water Dragon)
BaZi (Four Pillars of Destiny):
Year Pillar: Ren-Chen (壬辰)
Month Pillar: Yi-Si (乙巳)
Day Pillar: Jia-Wu (甲午)
BaZi Interpretation:
Year Pillar: Ren-Chen (壬辰)
BaZi Interpretation
Heavenly Stem: Ren (壬, Water) → Represents wisdom and liquidity.
Earthly Branch: Chen (辰, Earth) → Represents stability and accumulation.
Interpretation: Water is controlled by Earth, indicating XRP may face resistance in its early stages. However, with intelligence and strategy, these challenges can be overcome.
Month Pillar: Yi-Si (乙巳)
Heavenly Stem: Yi (乙, Wood) → Represents growth and development.
Earthly Branch: Si (巳, Fire) → Represents passion and vitality.
Interpretation: Wood feeds Fire, meaning XRP has strong innovation potential and market energy.
Day Pillar: Jia-Wu (甲午)
Heavenly Stem: Jia (甲, Wood) → Represents leadership and initiative.
Earthly Branch: Wu (午, Fire) → Represents enthusiasm and action.
Interpretation: Wood fuels Fire, suggesting XRP has strong leadership and execution power, enabling it to establish a solid market position.
Destiny analysis to predict its future trajectory for 2025 and 2026
2025 Outlook – Ding-Wei (丁未) Cycle
Prediction: XRP may enter a relatively stable growth phase in 2025, focusing on internal accumulation and resource integration. The emphasis this year may be on long-term planning and strategic adjustments rather than aggressive market expansion.
2026 Outlook – Bing-Wu (丙午) Cycle
Prediction: XRP could enter a more dynamic and aggressive growth phase in 2026, characterized by innovation and transformation. This year may see greater market competitiveness and influence for XRP.
-------------------
My Personal View
Considering the current environment, for XRP to appreciate steadily in 2025, the first priority is to resolve its legal dispute with the U.S. Securities and Exchange Commission (SEC). This process may take at least until April or May before more accurate information becomes available. After that, the approval of an XRP-related ETF could be the next major milestone, with further clarity possibly emerging in October. Additionally, there is speculation that XRP could be included in Trump’s Crypto Reserve plan, although no concrete details have been confirmed yet.
XRP’s overall performance this year will be influenced by these developments, leading to significant price fluctuations.
Today marks the first White House cryptocurrency conference, which may provide further insights. Resolving these key issues in 2025 is crucial for XRP to achieve sustainable growth. If they are successfully addressed, then 2026 could indeed hold great potential.
Let’s wait and see. haha
Leave comments below with your thought, you can try and do this via Chatgpt or Deepseek as well. ask following question “Based on the founding date of XRP on June 2, 2012, and its birth chart, let's share the Ba Zi (Four Pillars of Destiny) for XRP and its major luck cycles for 2025 and 2026.”
Elliot wave completed correction incomingElliot wave completed correction incoming 3rd wave is over correction generally follow before a huge pump.

XRP has been consolidating after a strong rally, but key levels 🚀 XRPUSD: Is the Next Big Move Coming? 📊
XRP has been consolidating after a strong rally, but key levels are forming!
🔹 Current Price: $2.5995 (+3.91%)
🔹 Key Resistance: $3.0029 (Supply Zone)
🔹 Major Support: $1.9580 (Weekly HL)
📉 Bearish Case: If XRP fails to break the supply zone ($3.0029-$3.2038), we could see a rejection leading back to lower support levels.
📈 Bullish Case: A breakout above $3.0029 could trigger another rally, pushing towards $3.20+ in the short term.
💡 Watching for confirmations near the 15min demand zone before entering a trade.
🔎 What’s your bias—Bullish or Bearish? Drop your thoughts below! 👇
#XRP #XRPUSD #CryptoTrading #PriceAction #TechnicalAnalysis #CryptoNews #CryptoSignals #DayTrading #Forex #TradingView

XRPUSD - Smart Money Concept (CHOCH & Supply/Demand)🚀 **XRPUSD – Smart Money Concept (CHOCH & Supply/Demand) 🚀
📊 Timeframe: 4H | 💰 Exchange: Binance**
🔍 Concepts Used: CHOCH (Change of Character), Supply & Demand, Market Structure
📈 Market Analysis:
XRPUSD recently showed a strong bullish reversal after tapping into a 4H Demand Zone, leading to a rally toward the Daily High (D HH) level. The CHOCH (Change of Character) confirms a potential shift in market structure from bearish to bullish.
🔹 Key Levels to Watch:
✅ Demand Zone: $1.9580 - $2.3683 (Strong Buy Zone)
✅ Supply Zone: $2.7299 - $3.0029 (Potential Rejection Area)
✅ Next Resistance: $3.2038 (Higher Timeframe Key Level)
📊 Trade Plan & Strategy:
🔸 If price retraces back to the demand zone, we may see a bullish continuation targeting $2.7299 - $3.0029 supply zone.
🔸 If price enters the supply zone, watch for bearish rejection and potential short setups.
🔸 Confirmation via candlestick patterns (e.g., engulfing, rejections) can strengthen bias.
📉 Market Sentiment:
📈 Bullish above $2.3683, targeting $3.0029
📉 Bearish if price rejects $3.0029 and forms a CHOCH to the downside
⚠️ Disclaimer:
🚨 This is not financial advice. I’m not a financial advisor. Do your own research before making any trading decisions. Trade responsibly! 🚨
📢 What’s Next?
📩 What do you think? Will XRP break $3.20? Comment below! 🚀
🔥 LIKE & FOLLOW for more Smart Money insights & trade setups! 🔥
#XRPUSD #Crypto #SmartMoney #SupplyAndDemand #CHOCH #PriceAction #TradingView #Forex #CryptoTrading #Liquidity #BreakOfStructure #TradingStrategy

inverted hammers during downtrend = BullishMultiple inverted hammers on 4H chart during downtrend means super bullish. So let's go. XRP to the moon !

XRPUSD—Are we ready for Wave 3?Trend:
Major Trend: Bullish
Minor Trend: Bullish
Note:
I believe Wave 2 (Green) is currently completed with a sharp pullback. If not yet completed, then it will form a new complex wave.
Next Wave 3 will have 5 minor waves.
This is only my EW view. No trade recommendation. Please do your own analysis before placing any trade. TAYOR.

There are three things that are keeping me from buying in xrpThere are actually four things that are keeping me from buying in xrp.
1.) How deep in debt are we?
A trillion more added every 60 Days.
How will we pay off the debt? With The Strategic Reserves.
1A.) Obvious answer is up!
But, you'd be wrong!
Investors already OWN THE ESCROW. They've been bought off with strategic monies, hidden wallet Addresses, being dumped on retail.
YOU ARE GOING TO PAY OFF THE NSTIONAL DEFICIT!
I SURMISE THAT XRP IS GOING DOWN TO 0.8646 but see support lines at: 0.7742 making 0.8645 an excellent buy in leaving many trapped at the top.
So much NEWS IS COMING OUT which conditions your mind in a way to think IT'S BULLISH NEWS!!!
BUT, THE PROBLEM IS YOU ARE SUPPOSED TO SELL THE NEWS!!!
THIS THING IS GOING TO DROPIKE A RO K, the same wY it did in 2018 when it hit 0.24
We are all going to pay the debt off through crypto.
The question is, do you want to pay ot off at the top?
Or Bottom?
2.) We are looking at a weekly chart!
TOP 3 INDICATORS POINT DOWN.
3.) The Buy Line and 21 Day EMA already have been hit leaving the 50 MA and 100 MA and 200 MA REMAINING.
4.)What I've experienced, once you are below the w1 Day EMA, YOU HAVE TO FIND BOTTOM.
What's the best way to trap you?
DROPIKE A ROCK wh where you can't recover.
See you at 0.8645

XRPBull or Bear?
Back to the program?
Pull or Pump?
You can look at prior resistance, levels and how deep they go.
Remember be patient,
D looks risky compare to W
4H Looks yummy
Long term, don't worry just stack.
Dont need to trade every day for big gains, think long term
Youll get a better return if you invest into this then anything

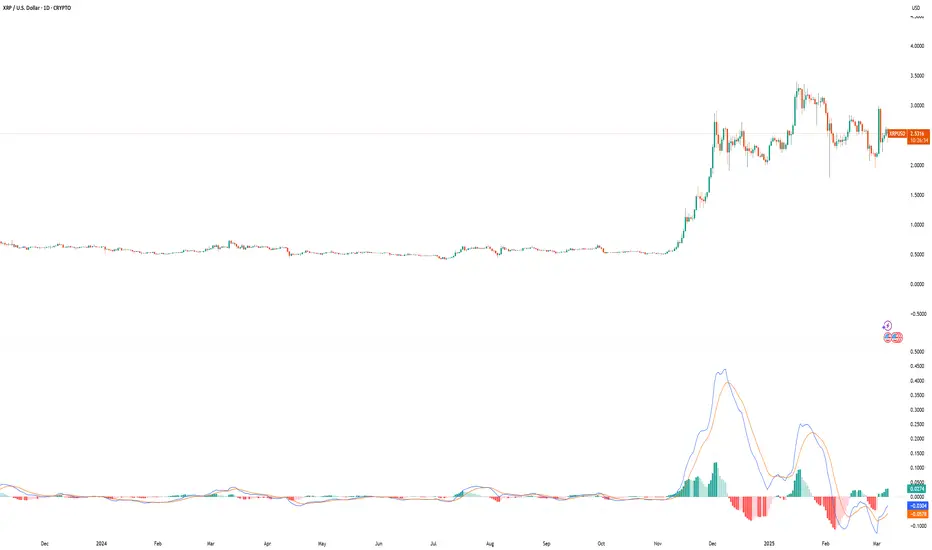
XRP/USDLooking at the XRP/USD chart, last month’s candle closed red, indicating selling pressure. However, it remained within the range of the previous month’s candle, suggesting that while sellers are present, their momentum isn't overwhelming. Analyzing the weekly timeframe, a head and shoulders pattern has formed—a classic bearish signal. Additionally, the price broke downward from a tunnel formation, further confirming the bearish move. This could be a temporary pullback before a potential continuation to the upside. Key levels to watch for a bounce are around $2–$1.90, but if this zone fails to hold, the next support to monitor is $1.60.

Why I think price of XRP will surge to $25, $1,000 and beyond?Over the weekend, Trump has explicitly stated that he intends to designate XRP and other digital currencies as reserve assets.
Why is Trump promoting digital currencies? What are the benefits, and how will this impact digital currency prices? Why I think the price of XRP will surge?
First, let's analyze the direct benefits that promoting digital currencies could bring to the U.S. government:
1. Enhancing Fiscal Transparency
By improving the transparency of government expenditures, digital currencies can reduce waste and corruption, ultimately lowering the fiscal deficit.
2. Implementing Targeted Fiscal Stimulus
By bypassing the Federal Reserve, digital currencies can enable precise fiscal stimulus, ensuring that funds reach target groups more quickly and efficiently.
3. The Digitalization of the U.S. Dollar: XRP Could Replace the Petrodollar
Associating digital currencies with U.S. Treasuries can help address liquidity problems in the repo market. For example, a “XRP Collateral Pool” could be established, allowing financial institutions to use XRP as collateral for short-term liquidity access, thereby supporting the stability of the Secured Overnight Financing Rate (SOFR) market. If XRP can be used as collateral for short-term liquidity operations (e.g., in the SOFR market), it will drive substantial institutional demand for holding XRP.
Traditional Treasury transactions require at least one day for settlement, whereas XRP can enable near-instantaneous settlements, enhancing market liquidity and reducing volatility.
This would further stabilize U.S. Treasuries and facilitate the transition from Petrodollars to digital currency-backed dollars.
If such a policy is implemented, considering that XRP has a fixed total supply of only 100 billion tokens, with an even smaller circulating supply, unlike fiat currencies that can be printed indefinitely. Its price is fundamentally determined by supply and demand.
If institutions accumulate large amounts of XRP as reserves, the available circulating supply will decrease, naturally driving prices to surge.
Among all digital currencies, XRP has the highest potential to fulfill this role. Trump is likely aiming to accomplish this within his four-year term. Let’s wait and see how this unfolds.

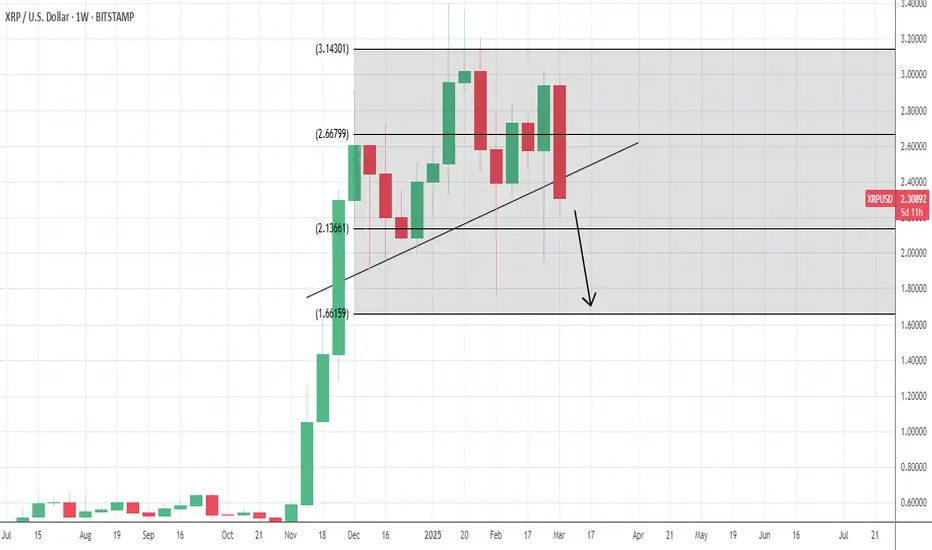
XRP Weekly-Monthly Analysis / Retracement Levels for BuyWeekly - Monthly trend: Bearish
Chart Pattern: Head & Shoulders (H&S) - Continuation Pattern
Retracement Fib Price Levels:
0.00% (3.4000)
23.60% (2.6879)
38.20% (2.2474)
50.00% (1.8914)
61.80% (1.5353)
78.60% (1.0284)
100.00% (0.3827)
Good prices for buy:
61.80% (1.5353) – Golden Zone / Golden Pocket
78.60% (1.0284) – Entry Zone
Between 78.60% (1.0284) and 100.00% (0.3827) is the Risk Zone, which we have the Neckline of the ‘’ Quadruple Bottom Pattern ‘’ at the price range ‘’ 0.6291 – 0.7850 ‘’

XRP Weekly-Monthly Analysis / Best Spot Major Prices to BuyBecause I noticed to much sentiment these days, I felt the need to mention, that Ignoring the investment rules such as F.O.M.O. (Fear of Missing Out), putting to much emotion on your trades, to discuss with the people, ignoring Top to Down Analysis, do not help you reach your goals.
TRADE WHAT YOU SEE, DO NOT TRADE WHAT YOU THINK!
Do not ignoring time frames:
Weekly and monthly time frames help us find the range of price action, where the price will support or resist, as also to spot the oversold and overbought areas. As well as removing market vibrations.
Monthly time frame help us to spot the trend in the following weeks.
Weekly time frame help us to spot the trend of the following days in the week.
Technically for investors who want to buy the XRP and hold it until the future for sell it at a satisfactory price, they have to make sure that the price is it's at its lowest.
On the Daily – Weekly time frame easily we observe the Head and Shoulders pattern which is telling us that the price will reverse and testing the lower prices before an uptrend.
On the weekly time frame we can see that the market signals us for a reversal. We can see the Hanging Man candlestick (09 Dec 2024) and the Bearish Engulfing candlestick (27 Jan 2025).
Major prices using Fibonacci Retracement:
0.00% (3.4000)
23.60% (2.6879)
38.20% (2.2474)
50.00% (1.8914)
61.80% (1.5353)
78.60% (1.0284)
100.00% (0.3827)
Spotting major prices helping us which price to buy. Good spots for buy:
61.80% (1.5353) – Golden Zone / Golden Pocket
78.60% (1.0284) – Entry Zone
Between 78.60% (1.0284) and 100.00% (0.3827) is the Risk Zone, which we have the neckline of the ‘’ Quadruple Bottom Pattern ‘’ at the price range ‘’ 0.6291 – 0.7850 ‘’ and safer zone to buy at ‘’ 0.9500 ‘’…
For sure we will meet a lot of consolidation at 50.00% (1.8914) before the prices will drop.
The only remaining is the fundamentals that we can apply them in the chart.
Thanks to all of you!

XRP - the next road!many confluences, standard deviation midline, diamond pattern and xrp favourite the 702!!

XRP/USD – 30-Min Long Trade Setup!📌 🚀
🔹 Asset: XRP/USD (Ripple / U.S. Dollar)
🔹 Timeframe: 30-Min Chart
🔹 Setup Type: Bullish Reversal Trade
📌 Trade Plan (Long Position)
✅ Entry Zone: Above $2.4094 (Breakout Confirmation)
✅ Stop-Loss (SL): Below $2.2802 (Invalidation Level)
🎯 Take Profit Targets:
📌 TP1: $2.5264 (First Resistance Level)
📌 TP2: $2.7085 (Extended Bullish Move)
📊 Risk-Reward Ratio Calculation
📉 Risk (SL Distance): $2.4094 - $2.2802 = $0.1292 risk per XRP
📈 Reward to TP1: $2.5264 - $2.4094 = $0.117 (1:0.91 R/R)
📈 Reward to TP2: $2.7085 - $2.4094 = $0.2991 (1:2.32 R/R)
🔍 Technical Analysis & Strategy
📌 Falling Wedge Breakout: Price has broken out of a falling wedge, a strong bullish reversal pattern.
📌 Support Rejection: The price tested $2.2802 support and showed buying pressure.
📌 Volume Confirmation Needed: Ensure high buying volume when price holds above $2.4094 to confirm bullish momentum.
📌 Momentum Shift Expected: If price remains above $2.4094, it could push toward $2.5264, and further to $2.7085.
📊 Key Support & Resistance Levels
🟢 $2.2802 – Stop-Loss / Support Level
🟡 $2.4094 – Breakout Level / Long Entry
🔴 $2.5264 – First Resistance / TP1
🔴 $2.7085 – Final Target / TP2
📉 Trade Execution & Risk Management
📊 Volume Confirmation: Ensure high buying volume above $2.4094 before entering.
📉 Trailing Stop Strategy: Move SL to entry ($2.4094) after TP1 ($2.5264) is hit.
💰 Partial Profit Booking Strategy:
✔ Take 50% profits at $2.5264, let the rest run toward $2.7085.
✔ Adjust Stop-Loss to Break-even ($2.4094) after TP1 is reached.
⚠️ Fake Breakout Risk
❌ If the price fails to hold above $2.4094 and drops back, exit early to avoid losses.
❌ Wait for a strong bullish candle close above $2.4094 before entering aggressively.
🚀 Final Thoughts
✔ Bullish Setup – Bouncing from $2.2802 support suggests a potential reversal.
✔ Momentum Shift Possible – Watch for volume confirmation.
✔ Favorable Risk-Reward Ratio – 1:0.91 to TP1, 1:2.32 to TP2.
💡 Stick to the plan, manage risk, and trade smart! 🚀📈
🔗 Hashtags for Reach & Engagement:
#CryptoMarket 📉 #XRPNews 📰 #XRPUSD 📊 #MarketUpdate 🔥 #CryptoInvesting 💰 #Trading 📈 #Finance 💵 #ProfittoPath 🚀 #SwingTrading 🔄 #DayTrading ⚡ #CryptoTrader 💸 #TechnicalAnalysis 📉 #XRPPrice 🏛️ #FinancialFreedom 💡 #MarketTrends 📊 #CryptoAlerts 🔔 #TradeSmart 🤓 #Bullish 🐂 #RiskManagement ⚠️ #TradingCommunity 🤝

XRP IS GOING TO 0.00 !!!!!!!!!!!!
Now that I have your attention...
XRP/USD
Aggressive analysis
------------------------------
If you want to aggressively scale into this asset, then your pool should be distributed around the 1.60 - 2.15 AOI's.
Here are the risk's
- You might get demolished if they do decide to send it to the weekly AOI's I have also shared above
- Your pool that you could have used on the weekly AOI's are now not as strong (unit accumulation) as it could have been had you waited.
- Your ROI is now worse since you accumulated at higher levels
Here are the reward's
- You gained more units if we do decide to fly
- You now have "PLAY TOKENS" which essentially mean tokens you will be selling at certain TP areas (which does not harm the bigger bag)
- You cant go wrong literally buying some right now but you have to accept the fact that youre inside the fluff and you will be taken through the crypto roller coaster.
Regards,
MR.OAZB


XRP | Know what you hold!XRP went on an absolute tear starting on November 3rd through mid-December during the 'Trump election pump,' but has pulled back and consolidated heavily. Even though we had a nice pump a few days ago when President Trump released his U.S. Crypto Reserve tweet, which featured XRP in the first position on the list, the price action has now retraced the majority of that move.
I wouldn't write off XRP just yet, and regardless of whether it drops more from current levels, there isn’t a crypto on the entire market that has the potential that XRP does moving forward—in my opinion.
Good luck, and always use a stop loss!

Bearish Signal Alert for Ripple (XRP)Ripple (XRP) has just triggered a major bearish signal by breaking below the crucial support level of $2.3575. This recent move is a significant indicator for potential further declines in the price of XRP. Investors and traders should closely monitor this development, as the break below $2.3575 could lead to an acceleration in bearish momentum.
Looking ahead, the next major support area to watch is around $1.7. If Ripple's price continues to descend, we can expect it to potentially target this next critical support level. Traders might consider this as a strategic point for assessing market responses, with the possibility of further downside if this level fails to hold.
It is advisable to approach trading with caution during this period and consider adjusting stop-loss orders to manage risks effectively. This bearish development could present opportunities for short sellers, but also warrants vigilance for any signs of a reversal or support at lower levels.
XRP MARKET UPDATEHey everyone, coming with a quick XRP update, I hope you guys enjoy. Give this video a like if you enjoyed my insights and comment down below where you see XRP going to.
Forex, Crypto and Futures Trading Risk Disclosure:
The National Futures Association (NFA) and Commodity Futures Trading Commission (CFTC), the regulatory agencies for the forex and futures markets in the United States, require that customers be informed about potential risks in trading these markets. If you do not fully understand the risks, please seek advice from an independent financial advisor before engaging in trading.
Trading forex and futures on margin carries a high level of risk and may not be suitable for all investors. The high degree of leverage can work against you as well as for you. Before deciding to trade, you should carefully consider your investment objectives, level of experience, and risk appetite.
There is a possibility of losing some or all of your initial investment, and therefore, you should not invest money that you cannot afford to lose. Be aware of the risks associated with leveraged trading and seek professional advice if necessary.
BDRipTrades Market Opinions (also applies to BDelCiel and Aligned & Wealthy LLC):
Any opinions, news, research, analysis, prices, or other information contained in my content (including live streams, videos, and posts) are provided as general market commentary only and do not constitute investment advice. BDRipTrades, BDelCiel, and Aligned & Wealthy LLC will not accept liability for any loss or damage, including but not limited to, any loss of profit, which may arise directly or indirectly from the use of or reliance on such information.
Accuracy of Information: The content I provide is subject to change at any time without notice and is intended solely for educational and informational purposes. While I strive for accuracy, I do not guarantee the completeness or reliability of any information. I am not responsible for any losses incurred due to reliance on any information shared through my platforms.
Government-Required Risk Disclaimer and Disclosure Statement:
CFTC RULE 4.41 - HYPOTHETICAL OR SIMULATED PERFORMANCE RESULTS HAVE CERTAIN LIMITATIONS. UNLIKE AN ACTUAL PERFORMANCE RECORD, SIMULATED RESULTS DO NOT REPRESENT ACTUAL TRADING. ALSO, SINCE THE TRADES HAVE NOT BEEN EXECUTED, THE RESULTS MAY HAVE UNDER-OR-OVER COMPENSATED FOR THE IMPACT, IF ANY, OF CERTAIN MARKET FACTORS, SUCH AS LACK OF LIQUIDITY. SIMULATED TRADING PROGRAMS IN GENERAL ARE ALSO SUBJECT TO THE FACT THAT THEY ARE DESIGNED WITH THE BENEFIT OF HINDSIGHT. NO REPRESENTATION IS BEING MADE THAT ANY ACCOUNT WILL OR IS LIKELY TO ACHIEVE PROFIT OR LOSSES SIMILAR TO THOSE SHOWN.
Performance results discussed in my content are hypothetical and subject to limitations. There are frequently sharp differences between hypothetical performance results and the actual results subsequently achieved by any particular trading strategy. One of the limitations of hypothetical trading results is that they do not account for real-world financial risk.
Furthermore, past performance of any trading system or strategy does not guarantee future results.
General Trading Disclaimer:
Trading in futures, forex, and other leveraged products involves substantial risk and is not appropriate for all investors.
Do not trade with money you cannot afford to lose.
I do not provide buy/sell signals, financial advice, or investment recommendations.
Any decisions you make based on my content are solely your responsibility.
By engaging with my content, including live streams, videos, educational materials, and any communication through my platforms, you acknowledge and accept that all trading decisions you make are at your own risk. BDRipTrades, BDelCiel, and Aligned & Wealthy LLC cannot and will not be held responsible for any trading losses you may incur.

PSX/USD – 30-Min Long Trade Setup !📌 🚀
🔹 Asset: PSX (Pakistan Stock Exchange Ltd.)
🔹 Timeframe: 30-Min Chart
🔹 Setup Type: Bullish Reversal Trade
📌 Trade Plan (Long Position)
✅ Entry Zone: Above $24.50 (Breakout Confirmation)
✅ Stop-Loss (SL): Below $24.00 (Invalidation Level)
🎯 Take Profit Targets:
📌 TP1: $25.30 (First Resistance Level)
📌 TP2: $26.01 (Extended Bullish Move)
📊 Risk-Reward Ratio Calculation
📉 Risk (SL Distance): $24.50 - $24.00 = $0.50 risk per share
📈 Reward to TP1: $25.30 - $24.50 = $0.80 (1:1.6 R/R)
📈 Reward to TP2: $26.01 - $24.50 = $1.51 (1:3 R/R)
🔍 Technical Analysis & Strategy
📌 Falling Wedge Breakout: Price has broken out of a falling wedge, a strong bullish reversal pattern.
📌 Support Rejection: The price tested $24.50 support and showed buying pressure.
📌 Volume Confirmation Needed: Ensure high buying volume when price holds above $24.50 to confirm bullish momentum.
📌 Momentum Shift Expected: If price remains above $24.50, it could push toward $25.30, and further to $26.01.
📊 Key Support & Resistance Levels
🟢 $24.00 – Stop-Loss / Support Level
🟡 $24.50 – Breakout Level / Long Entry
🔴 $25.30 – First Resistance / TP1
🔴 $26.01 – Final Target / TP2
📉 Trade Execution & Risk Management
📊 Volume Confirmation: Ensure high buying volume above $24.50 before entering.
📉 Trailing Stop Strategy: Move SL to entry ($24.50) after TP1 ($25.30) is hit.
💰 Partial Profit Booking Strategy:
✔ Take 50% profits at $25.30, let the rest run toward $26.01.
✔ Adjust Stop-Loss to Break-even ($24.50) after TP1 is reached.
⚠️ Fake Breakout Risk
❌ If the price fails to hold above $24.50 and drops back, exit early to avoid losses.
❌ Wait for a strong bullish candle close above $24.50 before entering aggressively.
🚀 Final Thoughts
✔ Bullish Setup – Bouncing from support at $24.50 suggests a potential reversal.
✔ Momentum Shift Possible – Watch for volume confirmation.
✔ Favorable Risk-Reward Ratio – 1:1.6 to TP1, 1:3 to TP2.
💡 Stick to the plan, manage risk, and trade smart! 🚀📈
🔗 #StockMarket 📉 #TradingNews 📰 #StockAnalysis 📊 #MarketUpdate 🔥 #Investing 💰 #Trading 📈 #Finance 💵 #ProfittoPath 🚀 #SwingTrading 🔄 #DayTrading ⚡ #StockTrader 💸 #TechnicalAnalysis 📉 #EconomicNews 🏛️ #FinancialFreedom 💡 #MarketTrends 📊 #StockAlerts 🔔 #TradeSmart 🤓 #Bullish 🐂 #RiskManagement ⚠️ #TradingCommunity 🤝
