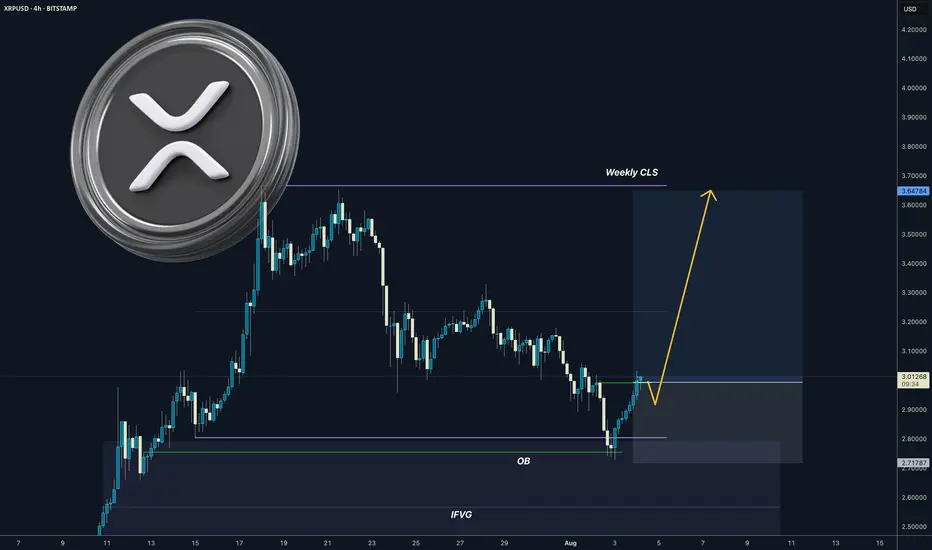
XRP I Weekly CLS I Model 1 I OB confirmations - Highs in playYo Market Warriors ⚔️
Fresh Crypto Analysis— if you’ve been riding with me, you already know:
🎯My system is 100% mechanical. No emotions. No trend lines. No subjective guessing. Working all timeframes. Just precision, structure, and sniper entries.
🧠 What’s CLS?
It’s the real smart money. The invisible hand behind $7T/day — banks, algos, central players.
📍Model 1:
HTF bias based on the daily and weekly candles closes,
Wait for CLS candle to be created and manipulated. Switch to correct LTF and spot CIOD. Enter and target 50% of the CLS candle.
For high probability include Dealing Ranges, Weekly Profiles and CLS Timing.
“Adapt what is useful. Reject whats useless and add whats is specifically yours.”
David Perk aka Dave FX Hunter
💬 Comment any Coin I ll give you my quick view
XRPUSD.P trade ideas
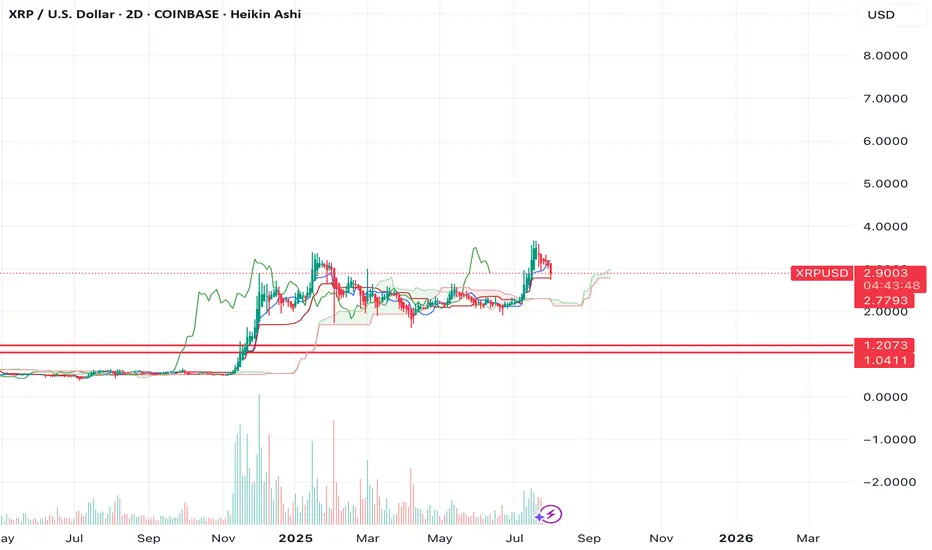
$XRP ENJOYERRRs see ya at $1.04-$1.20If we look at the chart of XRP, you can see that since the move in fall of 2024, we've had a massive lack of balance on the chart.
We ran up quickly without testing any levels as support.
That makes me think we're going to see the lack of balance get corrected and the same move is now going to happen in the opposite direction.
The $1.04-1.20 region looks like a good area of support to me.
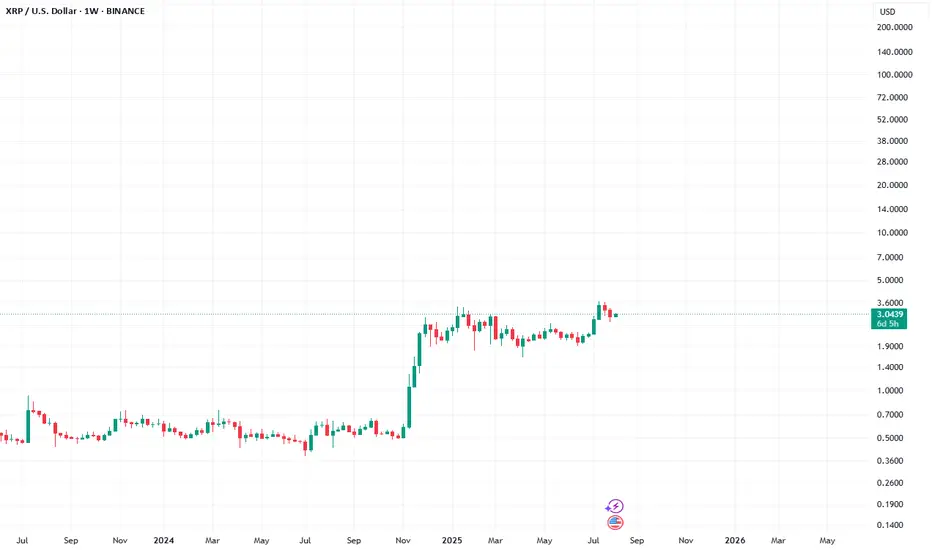
Xrp - It all comes down to this!🚀Xrp ( CRYPTO:XRPUSD ) has to break structure:
🔎Analysis summary:
After Xrp created the previous all time high in 2018, we have been seeing a consolidation ever since. With the recent all time high retest however, Xrp is clearly showing some considerable strength. It all comes down to bulls being able to push price higher, above the massive horizontal structure.
📝Levels to watch:
$3.0
SwingTraderPhil
SwingTrading.Simplified. | Investing.Simplified. | #LONGTERMVISION

XRP Path to 200XRP is so bullish.
Based on FIBS and Camarillas, this is a realistic path for the next 6 months to a year.
Gl hf.

XRP/USDFirst attempt at making a chart. I wanted something to refer to while watching XRP. Constructive criticism welcomed!
XRP Settlement August 15th, 2025 $33.00 & $1,031 May 23, 2026XRP is positioned for a major move on August 15th, 2025
when XRP reaches $30.00 - $33.00, it has two algorithmic delivery paths:
Path 1 (blue): Targeting $300 by August 23, 2026.
Path 2 (red): Parabolic extension to $1,031 by May 23, 2026.
“By the time you hear about it, it’s already too late.”
"News is the excuse for the moves."

RippleHow we feeling? This chart is very bullish. We didn't even get a retrace of the two prior peaks, so the price wants higher. Way higher. When you look at it in log, it's clear that $30 is in the headlights. It's kind of hard to deny.
I got into VVPR, and sold half in the profit, but the other half is lagging. I'll probably go heavier.
Good luck out there, and peace be with you.

All in XRPRegulatory Shift: Barriers for Ripple and XRP are easing, clearing the path for dominance in crypto/blockchain markets.
End of Retail Bubble: The retail-driven crypto era is fading, with institutional players paving the way for entry.
XRP ETF Progress: Eight XRP spot ETF applications from major funds await SEC approval, expected within months.
Ripple Lawsuit Nearing End : Resolution is imminent, setting a precedent for other crypto projects.
Blockchain as Infrastructure: The new U.S. Treasury Secretary and SEC Director recognize blockchain as critical national infrastructure, comparable to railroads and the internet in its transformative potential. This perspective aligns with the rhetoric of global financial authorities like the IMF, BIS, and WEF, as well as leading consulting firms, which have championed blockchain’s role in revolutionizing finance and cross-border transactions over the past few years.
Market Trends : Stablecoins, CBDCs, tokenization, and cross-border payments will drive growth, settling on public blockchains.
XRP’s Advantage : Stress-tested by global banks and governments for over a decade, XRP is uniquely equipped for large-scale enterprise adoption. Backed by Ripple, a leading fintech with connected leadership and top talent, XRP leverages unmatched expertise and a global network of bank and payment partners, driving innovation and solidifying its enterprise-grade infrastructure.
Market Performance: Post-election, XRP surged 500%, outperforming all coins, with stop-loss hunting below $3 likely over.
Conclusion and price prediction XRP remains largely unnoticed by mainstream media, its transformative potential yet to resonate with the broader public. Compared to Bitcoin, XRP is still in its infancy as a store of value and speculative asset for retail investors. Yet, as market dynamics shift and critical developments unfold, a potent blend of utility-driven demand and speculative momentum could propel XRP to $10 by the end of 2025. If Ripple’s vision of an Internet of Value takes root—enabling seamless, instant, and low-cost global transactions, capturing a substantial portion of SWIFT’s payment flows, and harnessing the power of tokenization—XRP could emerge as a cornerstone digital asset commodity, potentially soaring to triple-digit valuations by 2030 and fundamentally redefining its role in the global financial ecosystem.
XRP Critical Levels to Play This MonthHello I am the Cafe Trader.
This weekend we are shifting focus into the crypto market for a quick overview. If you read my last XRP article, we nailed the bottom for longs, and the sellers for a great positional play. This time we are going to analyze the current failed breakout.
Are Bulls Trapped? Does this still have room to leg up?
Point 1
We can start with the trend break. Massive buyers pushed this move higher, giving XRP a relatively quick All time high, But July 23rd shorts were able to shove this back inside of the previous high.
This signifies that there are bulls trapped, but the interesting thing to note is that the volume has reduced significantly since the last two ATH's. So this also would indicate a lack of buying interest at the highs.
Buyers are just not willing to to get involved with the same conviction as before (yet). No buyers, no continuation (even if there is not many sellers/profit takers).
Point 2
Strong buyers proved their interest with a "hot" reaction at $2.95.
With no "real" seller coming into this market yet, there is nothing stopping this continuation from legging up (so far).
Therefore I stand bullish, and am looking for a move up to $4.64 as a Target.
Point 3
Buying into this can feel tricky, your first entry for a classic two bar trend break would've been at the top of demand. I do think we will get another opportunity here, I definitely would not chase this, because it could play this range for a while before another leg up.
Setup
Trend break continuation.
Entry 3.13
Stop 2.65
Exit TP 4.64
Risk to Reward 3.1
If there is a close below these strong buyers, this could com all the way back down to 2.15-2.3 at least.
The reason for the wider stop here is because we don't want to get swept and then ran. A more conservative stop could be $2.85 which would be a 6R trade. Take your pick
Long Term
If you are late to the party on XRP (I know many are) here are some entries according to your sentiment:
Almost FOMO = 3.13
Aggressive = 2.95
Good price = 2.15-2.3
Steal = 1.60 - 1.93
That's all for XRP. We are going to be looking at Ethereum ETH Next.
Thanks for reading and happy trading!
@thecafetrader

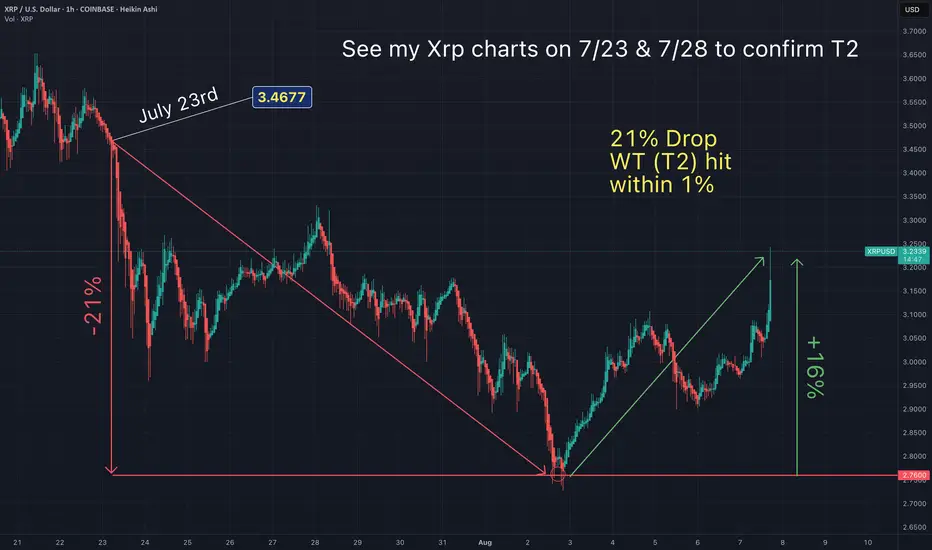
You will ask yourself "how did he know Xrp would do that?Here's a simplified summary of my prediction made on 7/23 & 7/28 for my ideal entry.
Feel free to review my Xrp charts on those days to confirm.
I keep stats on my accuracy and so should you.
How else would you know what influencer to actually follow?

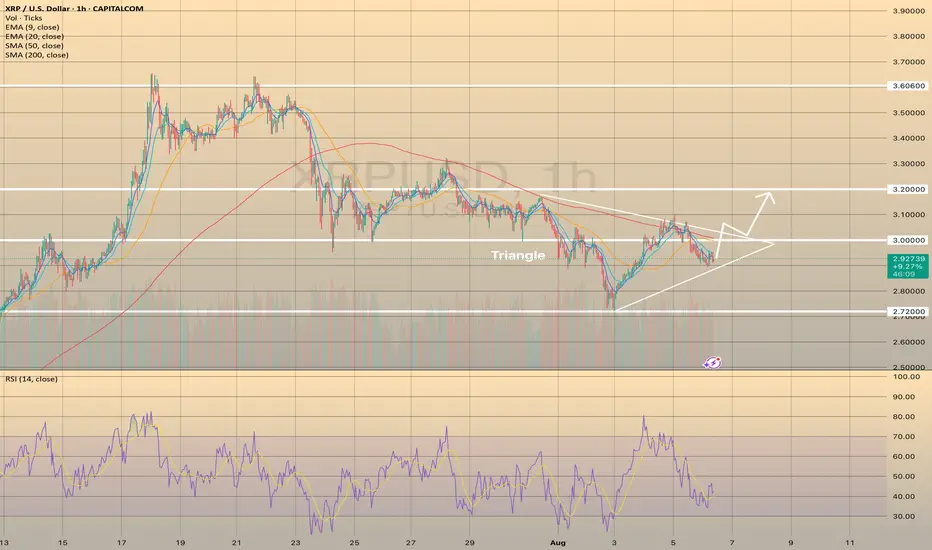
XRPUSD formed the Triangle pattern. The price may increase.XRPUSD formed the Triangle pattern. The price may increase.
XRPUSD has been declining since July 23, reaching the lowest mark at 2.72000 on August 3. Since then the price started to form the triangle pattern. It is not a reversal chart pattern, however, RSI indicator started to show some strength of the bullish momentum. In this case, if the price breaks through the SMA200 on hourly chart and holds above it and the level of 3.00000, the following rise towards 3.20000 is expected.
Xrp - This is the bullrun breakout!🔑Xrp ( CRYPTO:XRPUSD ) breaks the triangle now:
🔎Analysis summary:
After the recent bullish break and retest, Xrp managed to already rally another +100%. This is a clear indication that bulls are still totally in control of cryptos and especially Xrp. It all just comes down to the all time breakout, which will then lead to a final parabolic rally.
📝Levels to watch:
$3.0
SwingTraderPhil
SwingTrading.Simplified. | Investing.Simplified. | #LONGTERMVISION

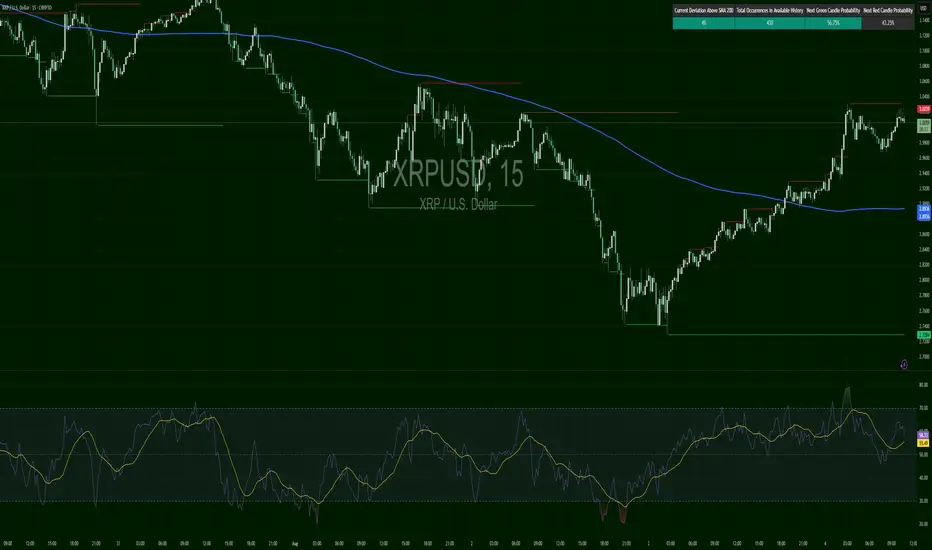
XRPUSD – Fade then HoldXRP saw an early-week fade from the $3.12 zone and is now trying to hold support above the 200 SMA ($2.96). RSI is gradually turning back up (44.27 to 50+ range soon), showing first signs of stabilization.
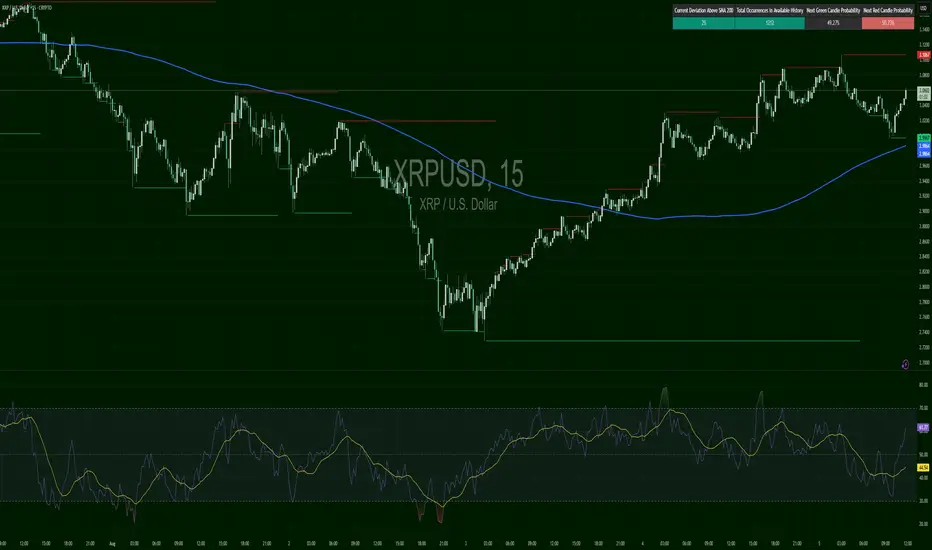
XRPUSD – Return to BattlefrontXRP lifted hard off support and is now hovering near $3.0166, just below resistance at $3.0329. RSI has surged back over 60, while green candle probability is decent at 56.69%.
Super bullish!! (I am not a XRP fan, but still) XRP is one of those cryptocurrencies that attract cult-like followers. I am not one of them.
Fundamentally I have no idea about the long term potential of XRP. HOWEVER, purely based on technicaly analysis, it looks very bullish to me.
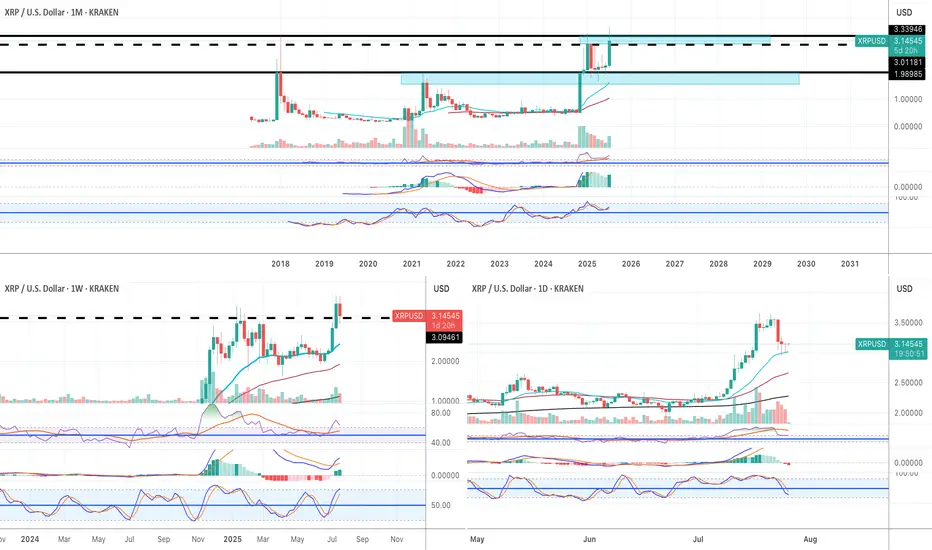
Monthly:
1) the price finally broke above the 2018 historical ATH.
2) All momentum indicators in the bull zone.
3) Both RSI and MACD are in the overbought territory but they can remain in the OB territory for weeks and weeks when the macro bull trend begins.
4) Stochastic lines have crossed to the upside in the bull zone.
Weekly:
1) all momentum indicators are in the bull zone.
2) The price broke above the historical ATH. It is going through pull back now, but, there is a strong buying pressure around $3.15.
Daily:
1) all momentum indicators have reached the overbought territory. The lines are now rolled to the downside, however, it is likely to be a corrective move.
2) the price is hovering above EMA21 where the recent price breakout happened on Thurs 17th July. I have been monitoring price action in lower time frames such as 5 and 15 minutes, and it looks like the price does not want to go below the previous historical high at this stage.
I am not very familiar with XRP, but purely based on the current price action, it looks very bullish. For the very first time as a trader/investor, I deployed my capital to buy XRP last Wed (just under $3.00).
I have already took some profit when it hit $3.60. But I am planning to sell 90% of my XRP when it reaches $4.50 and $5.00, and let the rest run just in case it goes to the moon😅.
XRP at $2.93? They Forgot What’s Coming?XRP isn’t just another coin. With clarity coming from major rulings, its return to previous highs isn’t just possible it’s probable. I like this level. Watching price and fundamentals line up.
I’m not just looking at the chart — I’m looking at the bigger picture.

$XRP Historical Golden Ratio - Weekly Timeframe The Historical Golden Ratio (HGR) is the Fibonacci-based market analysis methodology that I created in 2020 (but really discovered). It identifies critical price inflection points by applying Fibonacci in a very unique and fundamental way. It may appear complex from the outside to new and even experienced technical analysis, but under the hood is a very simple and logically built engine that only has two critical parts really. However, it reveals an underlying structure within markets that appears to be fractal-based and dictated by the Golden Ratio. For the experienced market participant, time behind the wheel will reveal that the driving force behind markets has been in plain sight all along; M = φ * H(t) * e^(k * I(t))

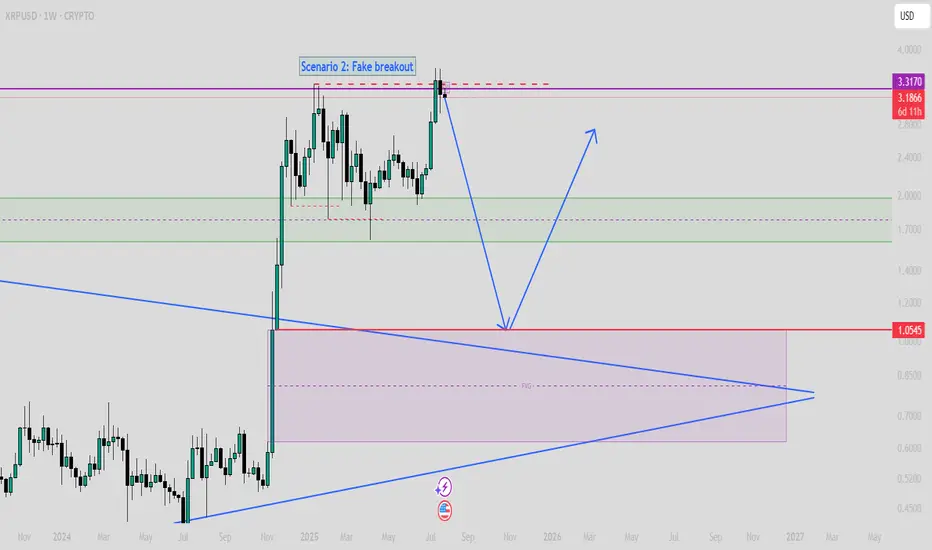
$XRP SCENARIO 2: Fake Breakout (Read caption)If XRP can't close strongly upper than $3.5 on the weekly time frame, then we must consider this scenario!
In this scenario, the first target will be $1.6, and then, based on time, even value around $1 is achievable.
XRP: Double zigzag correction scenario for Jun/July 2025 impulseA possible double zigzag pullback scenario correcting June & July's impulsive breakout, upon which normies & bears might say "head & shoulders" but then it climbs the wall of worry for a massive Wave 3 parabola.

T2 bounce now confirmed. Are XRP and alts now heading to my T3?On July 23rd my chart anticipated a 25% crash. Then a bounce.
That has been now been confirmed. I have taken taken profits at the top of this current bounce on alts. But now I am anticipating Eth and alts to drop to T3?
I will post my altcoin T3 targets if/when they hold resistance below my recently hit T2 targets. But I assume alts will bottom when Eth hits my T3 target posted on July 23rd ($2950)

Back to $4 - XRP weekly update August 7 - 13thXRP is currently advancing within a Minor Wave 3, which forms part of an Intermediate Wave 5 — itself completing a larger Primary Wave 1. This alignment across multiple degrees of trend suggests that XRP may be in the early stages of a broader bullish cycle with meaningful upside potential. The structure of the preceding Intermediate Wave 3 is clearly impulsive, which supports the idea of sustained continuation.
There is, however, some ambiguity in the early part of this current impulse — particularly in the development of Minor Wave 1. This leaves room for an alternative scenario that assumes a more complex correction may still be in progress. This would only be confirmed if the Wave 4 low is breached, thereby invalidating the current impulsive count.
Sentiment and market data currently favour the bullish outlook. Funding rates are positive, showing that the market is leaning long, and open interest is rising, indicating increased trader participation. Furthermore, the liquidity heatmap shows a notable cluster of liquidity above current price, which could serve as a magnet during a third wave — typically the most dynamic part of an impulsive move.
On a broader level, this anticipated momentum could also be fueled by macroeconomic developments. For much of the year, capital inflows into crypto were restricted by the Federal Reserve’s reluctance to lower interest rates. However, that could change soon: according to the CME Group’s FedWatch Tool, there’s a 93.6% probability of a rate cut at the upcoming FOMC meeting in September. Markets tend to front-run such events, and this expectation could trigger renewed retail buying — precisely the kind of sentiment shift that often fuels Wave 3 advances.
Importantly, institutional players appear to have already positioned themselves earlier, as evidenced by the formation of order blocks near the end of Wave 2. This suggests that what we’re witnessing now may be retail-driven momentum building on top of smart money accumulation — a classic dynamic in developing third waves.
As long as the current structure remains intact and the Wave 4 low holds, XRP is well-positioned for further upside — with the $3.50–$3.88 zone as a near-term target. The technicals, sentiment, liquidity positioning, and macro backdrop all point in the same direction: higher.

XRP - IH&SLike I said in my last post, xrp was to hit 2.80. Nailed it. Right on the money!
Now, it seems like we're printing an IH&S. No other real patters are matching up l well. We finally have some liquidity in the market to chart some rough patterns.
I'm seeing a little push up off the bottom BB - to 3.12 ish? But rejection back down to the daily pivot for the right shoulder. And acuminate there prior to any news from the SEC. And then were primed and strapped to a rocket!
But honestly, who really knows what these MM have in store. So stay light on your feet in this area.
Roll them bones for it!
