XRPUSD tested the Support line 2.1215 👀 Possible scenario:
XRP tested support at $2.12 and is now consolidating below $2.20. The price briefly bounced above the 23.6% Fib level from the $2.335 swing high but remains under pressure.
Despite the dip, XRP's fundamentals remain strong. It’s widely recognized for fast, low-cost cross-border payments and gained major institutional interest—including from the UN. Regulatory clarity after Ripple’s legal win against the SEC boosted investor confidence. XRP has surged 330% in the past year, and analysts see a bullish flag pointing to a potential breakout above $3.50 this summer.
✅ Support and Resistance Levels
Support level is now located at 2.1215
Now, the resistance level is located at 2.3370.
XRPUSD.P trade ideas

ripple TRADE 4 absultley smashed it with this trade i have had published late again but i do belive you could get into it now and catch the retracment back down bearish again this shit like clock work up down up down up down

XRP at Critical Support After a DropXRP has declined 4.37% and is now trading at a major technical confluence zone near $0.209. This level includes the value area low, 200-day moving average, and a key daily support/resistance flip, making it a pivotal zone for short-term price action.
While the presence of strong support increases the probability of a bounce, it’s important to note that price has been consolidating at this level for some time. The more often a support is tested, the weaker it becomes — raising the risk of a potential breakdown. A loss of this zone would likely trigger a liquidity sweep, targeting lower levels unless quickly reclaimed.
For bulls, a clean defense of this level with volume and a move back above recent local highs would indicate a potential rotation toward the next resistance. For bears, a breakdown without a reclaim increases the likelihood of continuation to the downside.
This current zone is an inflection point, and traders should wait for confirmation — either a strong bounce or decisive breakdown — before taking positions.

XBRUSD is moving within the 65.95 - 76.55 range👀 Possible scenario:
Oil prices eased on June 18, with Brent trading near $75.15 per barrel, as traders awaited the U.S. Fed’s rate decision and monitored Iran-Israel tensions.
The Feed is expected to hold rates steady, but concerns over slowing global growth and Middle East instability could influence future cuts. Analysts warn that conflict-driven price spikes may fuel inflation, complicating policy moves. Markets are also watching the Strait of Hormuz, a key route for 20% of global oil. While a full Iranian export hell could be offset by OPEC+ spare capacity, a blockade would severely disrupt flows, especially to Asia. Despite risks, Commerzbank noted the market remains well supplied, with slow demand growth and rising OPEN+ output. However, ongoing trade disputes may weigh on future demand.
✅ Support and Resistance Levels
Now, the support level is located at 65.95.
Resistance levels are now located at 76.55 .

XRP folks, Sonic / Fantom is nextADX reading is identical, just on different frame. This is one of those alts that normally holds its price instead of doing classic dump.
XRP still BULLISH and on track to $8Chart speaks for itself. Huge bull flag. Consolidation! Holding $2 support. RSI looking good with plenty of room to run up!!! Price coiling up for further discovery and ATHs. LFG!!!

ripple trade 4 i actully had my set up perfectly at my surport line but i forgot to upload it but this looks like its on track anyway belive it will test the highjer resistance level lets keep watching


Head & Shoulders Breakdown in Progress, Eyes on 1.83 and 1.61XRP is showing a classic Head and Shoulders reversal pattern, which has now broken down below the neckline, indicating a potential bearish continuation.
🔻 Bearish Structure Highlights:
The head and shoulders formation is well-defined and price has confirmed a neckline break.
The breakout is occurring within a descending channel, aligning with the broader bearish context.
Momentum oscillator (DTosc) is also turning down after a lower high, supporting the bearish case.
📉 Targets:
First target: 1.83580
Extended target: 1.61184
🔴 Invalidation Zone:
A daily close above the right shoulder and key resistance at 2.3589–2.4829 would invalidate this bearish view and signal potential reversal.
📌 Trade Plan:
Favoring short setups below the neckline
Targeting the support levels noted above
Stop-loss suggested above 2.48 for conservative risk control
The setup offers a clean risk/reward opportunity based on a textbook bearish reversal pattern.

XRPUSD Daily Analysis – Bullish Setup Forming Inside Key Range!XRP is currently trading at $2.2138, consolidating just above a critical demand zone and preparing for what could be a strong bullish breakout. The range-bound structure is tightening, and pressure is building for the next major move.
🔍 Key Technical Insights:
🔹 Major Demand Zone (Support) – $2.1470 to $1.8547:
Price has bounced multiple times from this orange demand zone, showing consistent buying interest and strong liquidity protection. It’s acting as a base for a possible bull rally.
🔹 Mid-Range Resistance – $2.5586:
This level has held firm since March. A clean breakout above it could attract massive volume and bullish continuation.
🔹 Final Bullish Target – $3.2967:
A powerful supply zone resides here, which is also the yearly high area. If XRP breaks $2.55 convincingly, we may see a strong push toward this zone.
🔄 Current Price Action:
Price has been accumulating sideways between $2.15 and $2.55.
Volatility is contracting, indicating a possible breakout ahead.
Recent candle rejections suggest buyers are stepping in at every dip.
📊 Trade Plan:
🔽 Buy Zone: $2.15–$2.20 (near demand)
🔼 Take Profit Levels: $2.55 and $3.29
🛑 Stop Loss: Below $1.85 (break of demand)
🧠 Fundamental Context:
🗓️ With major U.S. news events around the corner, volatility may spike. XRP could ride a wave of positive momentum, especially if sentiment improves toward altcoins. Keep an eye on regulatory headlines as well – XRP tends to react sharply.
---
💬 Are you loading your XRP bags here or waiting for confirmation?
Comment your analysis below! 👇
📌 Follow me for more crypto setups and price action strategies.
#XRPUSD #CryptoAnalysis #Altcoins #Ripple #PriceAction #DemandZone #BullishSetup #LuxAlgo #FrankFx14 #TradingView


XRP/USDT 2nd round bullish trendThis pair is due for its 2nd round upward trend.
July onwards should be bullish.
Let's see what happens.

Ripple: Lower Low ExpectedWe still expect magenta wave (2) to conclude within the magenta Target Zone between $1.03 and $0.38 – a range we consider attractive for long entries. That said, there's a 40% probability that magenta wave alt.(2) has already bottomed. If so, a direct breakout above resistance at $3.00 and $3.39 would confirm this alternative scenario and suggest that the corrective phase is already behind us.
📈 Over 190 precise analyses, clear entry points, and defined Target Zones - that's what we do.

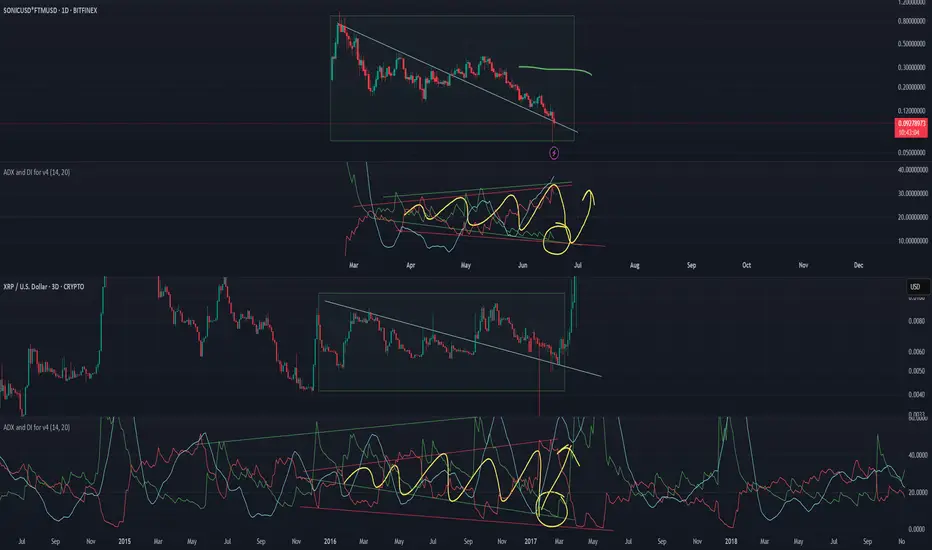
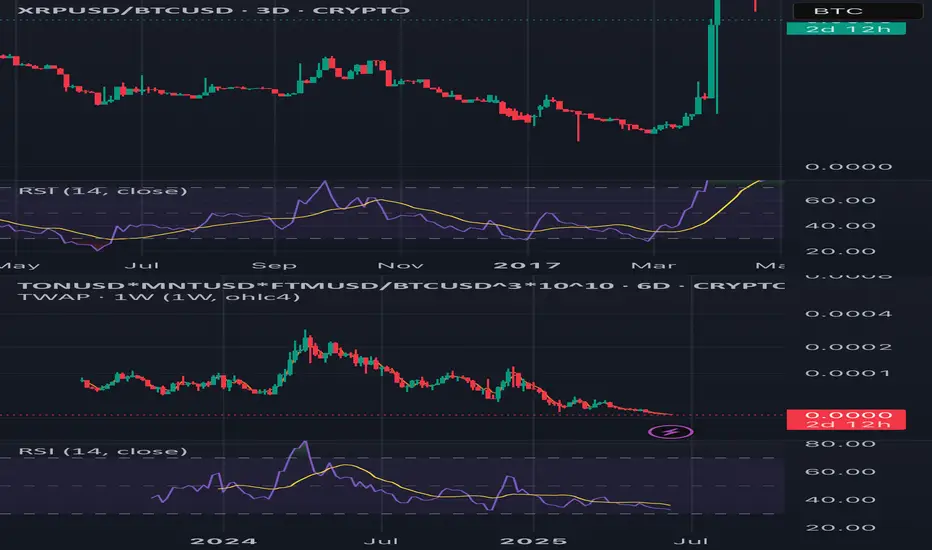
XRP up we go!XRP is ready for next leg up but main question now is....where does it go? Looking at chart we see same setup as we had in 2017 with completed Adam and Eve pattern, breakout of the pattern and test of breakout (we are currently in same phase). From breakout we got in 2017 1:1 measured move, consolidation and blowoff top. Same move today would mean that we get strong push to 30$ range, correction to 10$ and then blowoff top to triple digit range. On the other side looking at RSI pattern price behaviour since December 2024 looks more like consolidation we had in May-Jul 2017 (see yellow boxes). That consolidation resulted in blowoff top run toward local fibb 2.618 level, same move today would mean one last push toward 12-15$ range.
So how to play those 2 scenarios? Reasnoble approach would be securing profits at local fibb 2.618 range (12-15$) where I expect correction and if we bounce strongly from local fibb 1.618 level (5.65$) we get signal that we have one more push higher - toward 35$ range and then correction from there to at least 12$ level....

Mantle, Toncoin, Fantom/SonicAn ungodly chart that could outperform market soon as did xrp in 2017. Add to that, chain link and Uniswap.
xrpusd - fractal from the beginning Everything is fractal: big repeats small, and small repeats big. So if you want to do something big, you start small, then go a little bigger to understand how it works and how forces of nature affect it. As a result, small machines were designed first, then large ones. The same applies to graphs and patterns. Strength lies in simplicity.

XRP Finds Base Near $2.10, Climbing CautiouslyXRP suffered a steep sell-off to around $2.10, but has since rebounded and is stabilizing near $2.17. While the upward grind shows buying interest, the structure is still weak and awaits a clearer breakout.

rippleTRADE 4
i rerally like ripple im normally spot on but ive only traded it a few times i feel like follow the old trade set up i did and follow the bullish into my entry level and pull the trigger on a buy to the take profit margin again

XRP/USDT, 4H chart, Futures - Bullish projection.By major chart projection, I look for bullish positions in the price of XRP, as projected for approximately 1 to 3 days per pattern.
At this moment is where we make decisions attached to a strategy, I go inside. good luck in your operations and good business

rippletrade 4 i entered this tarde at entry point just didnt post it until now i belive ripple will go to the bearish take profit mark as this is a key price range we see where it goes to but i enjoy trading rippple

XRP: Selling Pressure Could Push Price to $2.22FenzoFx—Ripple (XRP) is testing the $2.34 resistance zone, marked as a key level by the Volume Profile Indicator. RSI 14 shows bearish divergence, while the Stochastic oscillator remains in overbought territory, signaling potential selling pressure.
If $2.34 holds, a bearish wave could target $2.26, with further downside to $2.22 if selling pressure persists.

rippleTRADE 4 coming into a area of resistance, should reverse and hit a aprice value and start to come down if it doesnt and breaks the resitance and uses the resistance as surpport then we will wait for the price to use the surport and go long, i belive ripple is bullish anyway but it runs of news so we just do what we belive and right now no news is out about it so i reckon there will just be a fluctionation from the top of the supply and demand box to the bottom

XRP - TRADE CAREFULLY HEREPrice is currently sitting in a wedge formation.
The red trendline is from the April low to the 5 June Low.
The Greenline is from the 16 Jan high to the May high. (TRIANGLE WEDGE) There is also a Head and SHoulder on the daily.
The price is struggling to stay above the $2.30 mark that I also wrote about in May. This level is also a pivot point.
Price may break higher in the short term (current week) to $2.45 that will line up with the GREEN Downtrend line. I doubt that we make a big move past this level this week.
If the $2.30 still holds as Resistance on a daily close by the end of this week I fore-see a bigger drop to come before the bull run. and yes maybe another 10 000 pip drop as earlier in the year that will send prices to the $1.20 to $1.30 area that is also in line with the 72% Fibo from the Nov'24 Low move to Jan'25 High. But for this we will need a daily close below $2.00 support as well a some bad fundamentals from the USA as well as current SEC thay may postphone the ETF application outcomes to Nov'25.
I will be carefull to go more bullish from here.
