How early on Quant? Let me knowFuture history, not fInAnCiAl advice
I want to engage with the community and find out how early other investors are to the next leg up
XRPUSD.P trade ideas

XRP IMO we are just waiting on things to kick off across the board in crypto..
BTC has made its new ATH and we know what comes after. !

Weekly trading plan for XRPIn this idea I marked the important levels for this week and considered a few scenarios of price performance
XRP looks weak against the rest of the market, price under the pivot point level
Write a comment with your coins & hit the like button and I will make an analysis for you
The author's opinion may differ from yours,
Consider your risks.
Wish you successful trades ! mura

Trade setup on XRP (swing trades) Green are the areas to look for longs.
Red are short options or profit taking.


Xrp- a small case for upsideRipple is a coin that is loved fervently by retail and despised vehemently by crypto natives. People who spend the bear market in the trenches tend to avoid it due to skepticism about FDV and other metrics and then retail comes in for a blip in time and pumps it to Valhalla and dumps on crypto natives and leaves without explaining.
If bitcoin hits 250k , retail is coming back and pumping this to $9.
Downside : price is currently trending near previous ATH of 2018 so there's a risk of double top and crash to 50¢
Upside : dark days are behind us. Why zoom out more than necessary. Worst is behind us. We're in an uptrend.
minor downside : oh no, we zoomed in too hard and the chart seems to be in a downtrend. well it doesn't matter unless you're high leveraged . Zoom out moderately, relax for a bit, and wait for retail to arrive.

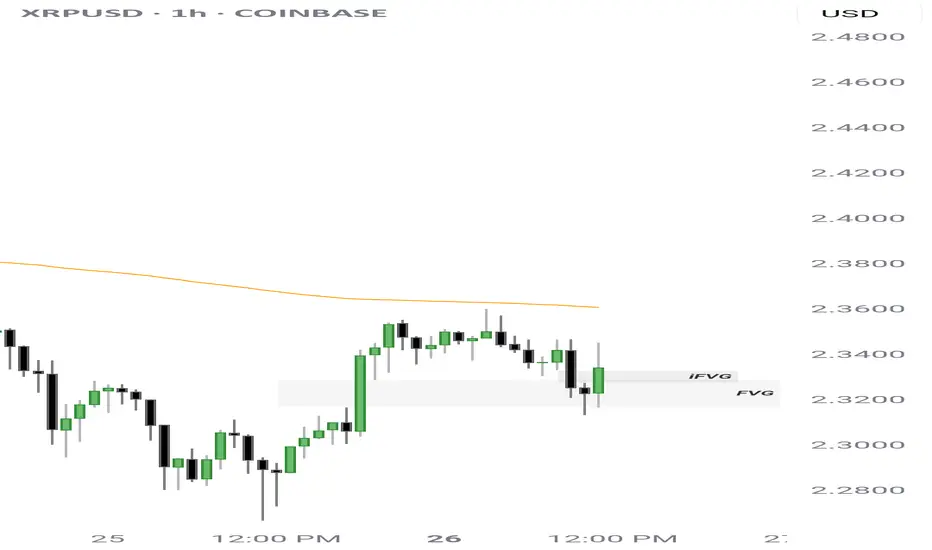
XRP BULLISH bounce off $2.32 FVG followed up with a bullish Inversion FVG forming.
This week we will break above $2.40 & may never see sub $2.20 XRP ever again. The next leg up will be a very fast move up, leaving many empty handed.
What does your exit strategy look like?
XRUSD Price Market Trend Day TF Long Term BUYXRPUSD is trading at 2.33674, with a strong recommendation to buy for long-term gains. The chart indicates a potential upward trajectory, with price targets set at:
TP1: 2.44200 (Near-term resistance)
TP2: 3.00500 (Mid-term target)
TP3: 3.40000 (Long-term bullish goal)
The mention of 3.40000 at the top of the chart suggests this is a psychological resistance level, reinforcing the optimistic outlook if bullish momentum sustains.

XRP's Path Forward: Will the Uptrend Continue?FenzoFx—XRP (Ripple) rose from $2.266, validating this demand zone for the week. The uptrend stalled at $2.360 during the early London session due to profit-taking and new market participants.
We expect XRP/USD to decline toward the FVG area at $2.30–$2.31 before resuming its uptrend. A break above $2.36 could trigger a move toward $2.38, followed by $2.40.
The bullish outlook is invalidated if XRP falls below the $2.26 support level.
Trade XRP/USD swap free and low spread at FenzoFx.

INVERTED HEAD AND SHOULDERS!! XRP DAILY!!Consolidation of the left shoulder has formed, the inverted left shoulder has formed, wait for a break-in, once the market closes, wait for retest, then buy to the resistance.

XRPUMy vision where going XRPU.
Now we on bullish trend after price was falling.
First Resistance is 2360 if we break up second 2420

Declining volume - waiting for the next impulsive move - + 5 $For about 126 days we are just are in a ranging movement. We can see that we have for all that time declining volume, keep this mind when the volume start to rise.
We are retesting the channel formation, perfect testing all moving averages and we tapped the golden ratio.
New all time high is around the corner (i believe)

XRPWe must fill the gap at $2.15 before we move higher.
I believe we will continue moving down through the end of May, until then we must Dollar Cost Average.
This is not financial advice, but this is what I will be doing moving forward.

XRPXRP just created a Inversion FVG on the 1h timeframe, paired with a sweep of the Previous Day Lows, indicates a strong move upwards.
We should see a retest of Previous Day High at $2.36 which may lead to a test of a 4h FVG between $2.38 - $2.40.
If we get any big announcements this weekend, we may see run towards $3 heading into the week.
Have an exit strategy once we have our banana move, it's been a great journey.
LOCK IN.

Xrp price.Xrp broke my channel in my last idea....but it is still in the triangle ...the rsi is in the good position and it may bounce of the 50 mark and go to the over bought zone...if that happens and xrp go above 2.61$ ...it breaks the weekly triangle which is extremely bullish in my opinion.

XRP Coiled for Breakout. Eyes on $5 if Trendline Holds.XRP/USD is trading above a long-term rising trendline, consolidating tightly in a bullish compression pattern.
This setup resembles a classic “coiled spring,” with price tightening just above key support. We’ve had consistent higher lows since late 2024, and the current structure favors a breakout over $2.70, which would open the door for a run to $3.50 and $5.00+
1. Trendline Support: Clean bounce from ~$2.00, higher lows holding since November 2024
2. Resistance: Horizontal resistance at $2.70 is the breakout level
3. RSI: Neutral (~50.88), resetting for a fresh move
4. MACD: Bullish crossover, momentum building slowly
5. Volume: Declining — typical before breakout patterns
A. Buy Zone: $2.00–$2.20 (support touch)
B. Breakout Add-on: Over $2.70 with strong volume
*Risk management is key. The longer this consolidates above trendline support, the stronger the breakout move will be. Of course, all is probability, but this is what I'm seeing.
**Clearly this isn't investment advice, only educational. ALWAYS seek a professional when investing.

XRP BULL RUN LOADING - MID MAY BREAKOUT??My analysis is that we will see a bull run middle to end of may that breaks us out of the bullish flag that we see on our weekly chart. It may take longer than that but eventually we will breakout of that pattern and our next ATH should be something like 5$. Thoughts?


XRP AND A QUICK FRIDAY LOOK🔥 Hey hey, happy friday, it's definitely a busy one but hope everyone's doing well. As usual, we'll get going with our thoughts and try and keep things short.
🔥 Gonna focus on technical for the most part today as we look at things and follow up from our previous idea which is also linked below for reference.
🔥 Looking at our 2 hourly we can see that we're still we continued with the trend and we're able to keep within that ascending channel but we did end up hitting a pretty tough resistance at $2.5 at which we got a pretty quick reversal, sell off. More than likely a coordinated move to sell off enough to have us lose that 200 EMA which was successful.
🔥 We ended up losing that 200 EMA and as of currently we've exited our ascending channel so to get reference on things we've got our Fibonacci chart below to find some good horizontal levels, especially as we approach an important support level being $2.99-3
🔥Next few day's I'll be keeping watch of that Fibonacci Retracement Chart for those levels. It's not perfect but gives some pretty good insight on things and these sort of horizontal channels we've got. Take $2.45-$2.42 for instance. Whenever we got out the channel we broke out or at least tried to and whenever we fell below that $2.35 support we'd get vice versa and fall, retrace.
🔥 So main things so watch right now are whether or not we can keep within that channel or if we'll fall into the one below and if we can regain that 200 EMA or if we fail by which then we could be seeing a retest of $2.99 and should that fail look to $2.20 and $2.10.
🔥 Regardless, XRP still stands in a great position for the long term as we last noted on our previous Big picture idea and whatever happens within the next few days and weeks will simply be market makers playing their game and technical running things till we get some more news or developments. On that note I've got to run but happy we could get something quick out today.
🔥 And as always, thanks so much for the support! Really appreciate it and let's keep at it till, same as ever. Always have more to gain and get done, work towards. Till next, keep posted and have a positive day.
Best regards,
~ Rock'

Xrp price .Xrp is now holding for dear life...this is very important if it breaks the channel we might see prices like 2.20 to 2.10 again

Xrp price.Xrp is still moving in the channel....if xrp stays in this channel i predict in the next week xrp will break weekly triangle and we would see new all time high.

XRP - SHORT TERM PREDICTIONIM BULLISH LONG TERM, BUT THE PULLBACK FROM $2.60 IS VERY LIKELY DONT BUY WITH DONT BREAK THIS RESISTANCE LINE.
MAJOR PLAYERS CAN STILL TAKE PROFIT HERE AND THEN SELL-OFF TILL WE BETTER CLARITY FROM THE SEC REGARDING THE ETF APPROVALS.
In this Idea I focus on the XRP thats currently at major resistance around $2.60 to $2.70.
If this resistance levels break and holds support above $2.60. I believe we wont see the pullback.
If we dont close above this Resistance this week will have a pullback to $2.30 and even lower.
Next week will be a busy week for XRP as we might have more feedback from the SEC regarding the ETF approvals for XRP. If this fundamental aspect get clear guidance from the SEC this pair will surge to all time highs.
I would suggest not to buy now unless we have a good break above the $2.60 level.

XRP ROAD TO $20+when we compare the move we had in 2017 with what XRP is doing now we see that we completed wave 1, we went to the ATH from '17-'18
wave 2 wicked to the top from '21
We turned that resistance into support
wave 3 to $12-$14 XRP is our next target
invalidation would be when we close candles below $2
Still long for now
Time will tell
