6month log chart on xrpusd suggests crazy potential targetsThe bull pennant we are in shown here on the 6month time frame seems to have a symmetrical triangle for its flag. The breakout target for just the symmetrical triangle is in the $33 range. Factor in the pole of the flag and the potential target skyrockets to 1.2k. Definitely not financial advice and certainly no guarantee it will hit either target as it’s still up in the air if log chart targets reach their full target as reliably as linear chart patterns do. Even if it does hit these targets you can see the apex of the pennant in its current trendline trajectories doesn’t occur until 2026. The only way I see price remaining inside this triangle for that long is indeed if the SEC ripple case is extended through appeal and taken to the Supreme Court. Hopefully not but it isnt impossible. If this were to occur I would simply keep dollar cost average accumulating until it was to break out from the triangle which would give me more opportunity to take some profit at the first target but then also hold onto some of the asset in case it does indeed reach the full bullflag breakout somehow all the way up at 1.2k. Simply posting this hear so I can see how well price action chooses to follow this pattern over the next year or few. Once again *not financial advice*
XRPUSD.P trade ideas

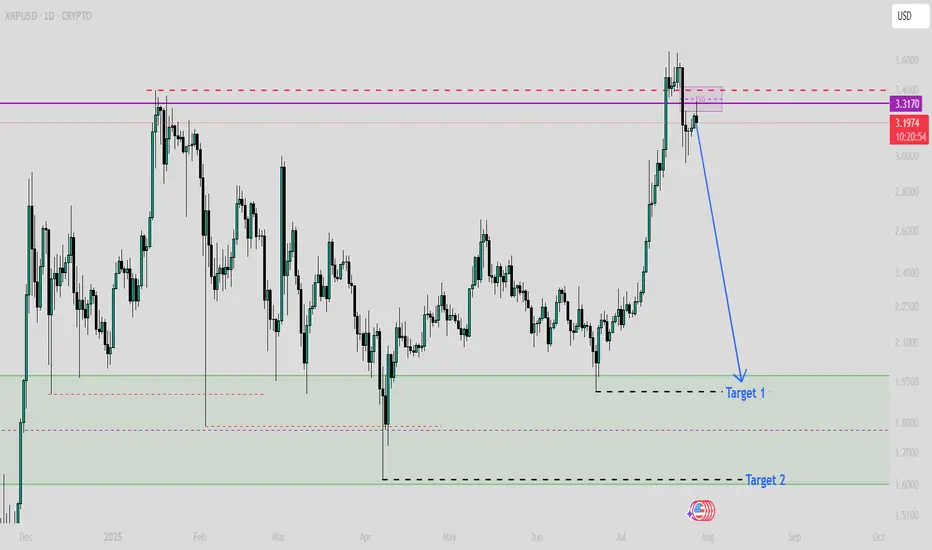
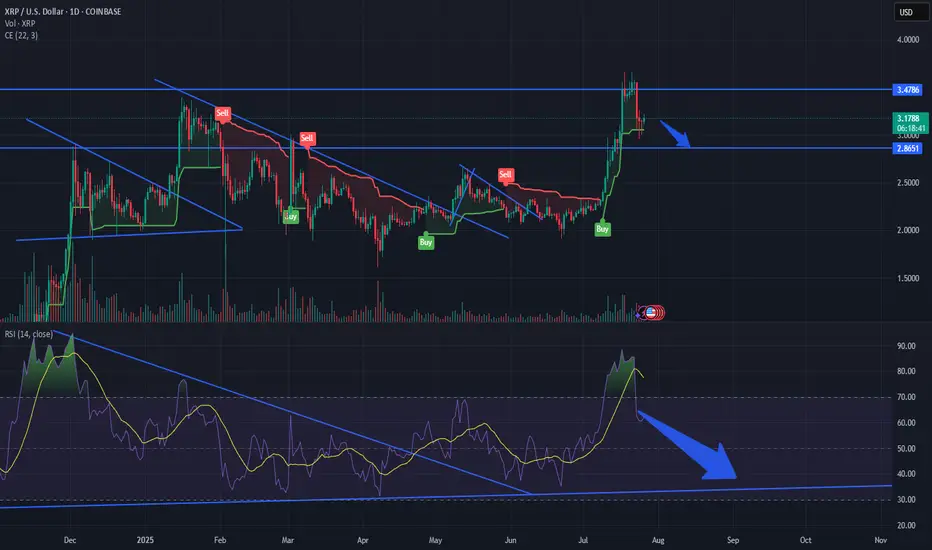
$XRP on Daily TF is not bullish!! (Read Caption)Need a Strong Weekly breakout candle to invalidate this scenario!
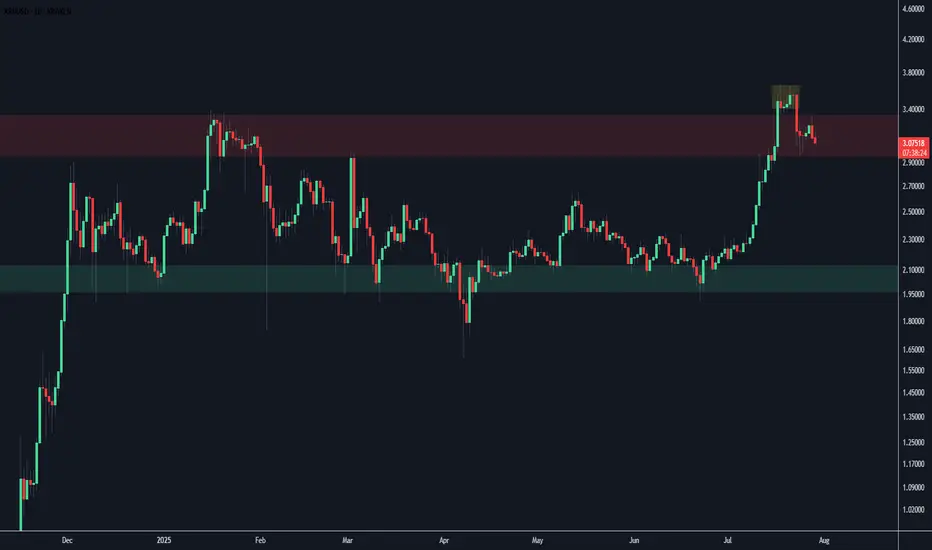
XRP to 2.80So, conjugate waveform or Elliot wave retracement is 5 steps. With 3 being the longest. 5 obviously the lowest. Once a demand or supply zone is tapped/broken into, they want the extreme of that zone. That's why I think 2.80 low.
With, 1234 break on Z out of the bearish Pennant into the demand. Forming the bottom of the, now larger C&H.
And aAaAway we go!

HEAD & SHOULDER DAILY TIME FRAME! (DOUBLE WHAMMY!!!!)The market has previously created a left shoulder. Now, it has broken out of the top of the Resistance and broken back into the support and resistance, about to form the right shoulder.
Wait for retest of the resistance then sell to the support, AND THEN BUY IT BACK TTHE RESISTANCE!! DOUBLE WHAMMMY!!

XRP/usd.tXRP is in a sweet zone at the moment to reverse and go higher. We are seeing a healthy retrace. Buckle up and enjoy the ride!
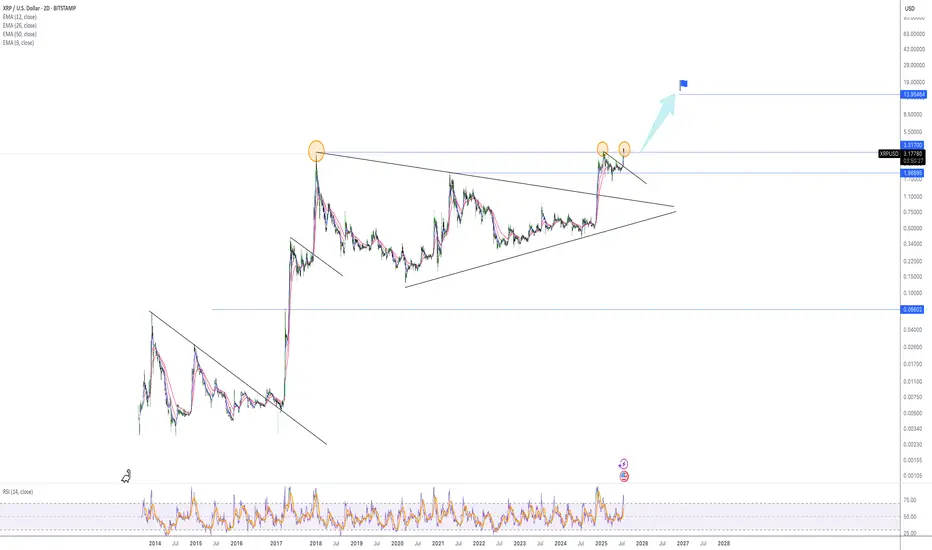
XRPUSD Massive break-out that can Top at $12.500XRP (XRPUSD) got out of its Accumulation Triangle (December 2024 - June 2025) making an aggressive break-out similar to the December 2017 one, which was after an identical Triangle pattern.
The fractals are so comparable that both mostly traded within the 1W MA50 (blue trend-line) and the Mayer Multiple (MM) 2 Stdev Above (orang trend-line).
As you can see, that MM trend-line was where the Top of the previous Cycle (April 2021) was priced and the one before was above the 3 Stdev Above (red trend-line).
Assuming that this Cycle will also go for the 'minimum' 2 Stdev Above test, it can make that contact by the end of the year on the 2.0 Fibonacci extension (Cycle Top-to-bottom) at $12.500.
-------------------------------------------------------------------------------
** Please LIKE 👍, FOLLOW ✅, SHARE 🙌 and COMMENT ✍ if you enjoy this idea! Also share your ideas and charts in the comments section below! This is best way to keep it relevant, support us, keep the content here free and allow the idea to reach as many people as possible. **
-------------------------------------------------------------------------------
💸💸💸💸💸💸
👇 👇 👇 👇 👇 👇

Can XRP Run 30% next week While we seen a clear cool of from XRP bullish movement in the last week are we now looking at an aggressive opportunity for the this sssest class shoot up %30 to create a new ATH of $4 and possibly beyond? Interesting times ahead with some strong news heading into next week XRP Army will have to wait and see what news comes out and will that influence XRP’s price point. The asset class sits around $3.28 at the time of this article post.
Cheers FC / EDub / AJ

xrp correction time rsi indicates oversold RSI is oversold on the 1 day daily correction happening next stop $285 ish good luck
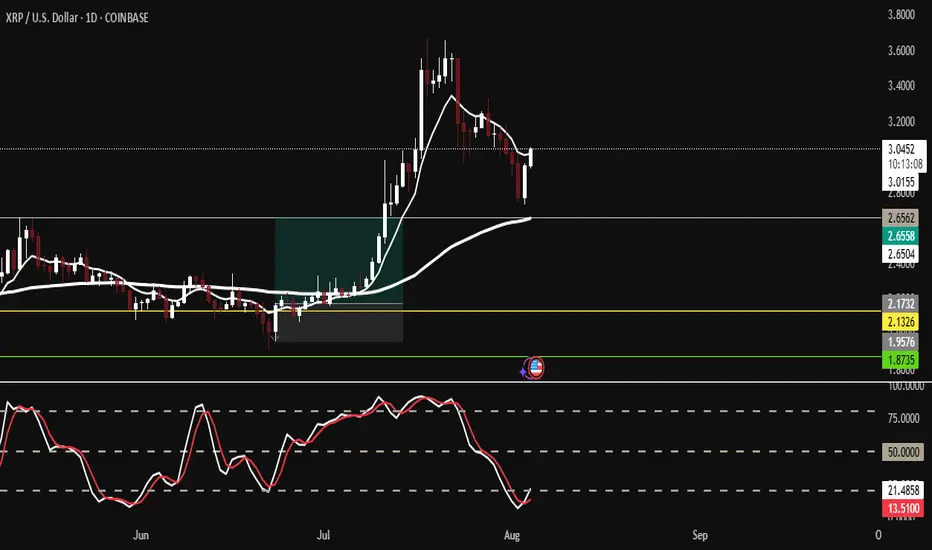
XRP Confronts Daily SMA ResistanceFenzoFx—XRP remains bearish, trading below the 50-period daily SMA at around $3.18. The SMA acts as resistance. Immediate support lies at $2.96. A break below this level may trigger further downside toward the $2.66 demand zone.
On the upside, a close and stabilization above $3.27 would invalidate the bearish outlook. In that case, momentum could push prices toward the previous highs at $3.65.

XRP Daily ChartReally starting to move down after ranging between this resistance this week.
Could easily make all time lows as easily as all time highs, not a bad price to take some profit.
XRPUSDT Buy Pullback to Weekly LevelBINANCE:XRPUSDT pullback to weekly level.
Note: Manage your risk yourself, its good trade, see how much your can risk yourself on this trade.
Don't be greedy.
Use proper risk management
Looks like good trade.
Lets monitor.
Use proper risk management.
Disclaimer: only idea, not advice

XRPYeah looks like we might be losing some strength ..
maybe after J.P speaks later this week could just makes us bounce . Until then it’s a fight to get back over the MA .
So we could go lower short term

XRPUSD broke the trendline resistance likely will go upXRPUSD was trading in down ward and recently formed the double bottom and broke the resistance and will likely to go up.

Relax and watch the show - target = 13 dollarDear,
In a bull market it is normal to see a 10, 20% pullback before the next impulsive wave.
It is a normal level for XRP to reject for now because we came near the ATH.
With the next test of ATH i believe we will move fast trough it.
My personal target for this bull run is 13 dollar. It can go higher but i believe the market will be overbought.
Currently the RSI levels are cooling of, the 1H and 4H oversold so i believe we will reverse soon.
Take care.
XRPUSD - Target reached. Reversal on the plateSo, that was a nice long trade.
Now price is stretched at the Upper Medianline Parallel (U-MLH).
As of the time of writing, I already see price pulling back into the Fork. A open and close within the Fork would indicate a potential push to the south.
Target would be the Centerline, as it is the level where natural Meanreversion is.
Observation Hat ON! §8-)

XRP/USDNew chart following the spike.
Currently battling at previous 2 week high around the 3.31 mark. I see a retract back to the 3.11 mark with a return to 3.76 region.
If we are lucky enough to reach the 3.57 mark i am planning to do a healthy profit grab with anticipation of a possible quick drop.
This is my second chart. I have enjoyed learning and observing everyone's charts. I am open to any suggestions on how to improve accuracy.
kdm62692

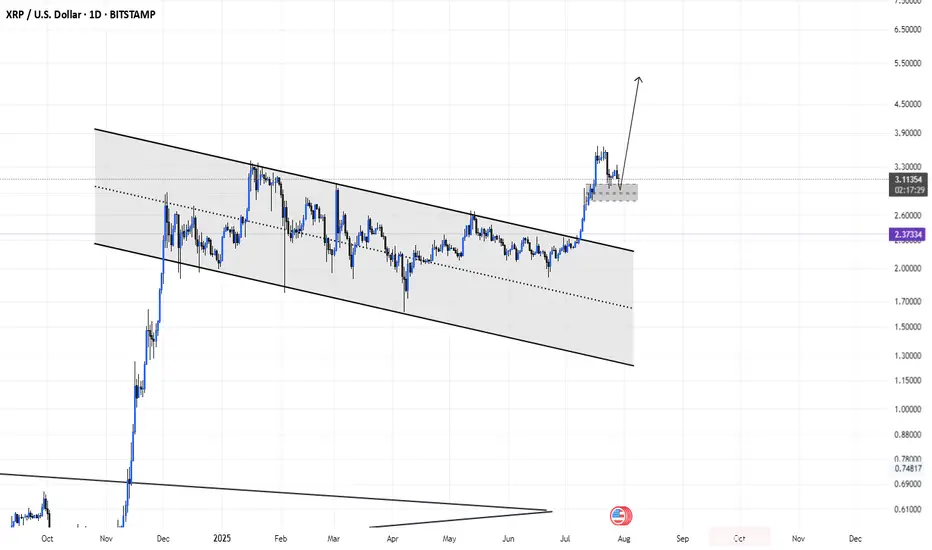
Vague idea of purchaseXRP after this sideways we had a median breakout if prices remain like this and there is a pullback to the next support.
It would be a huge trigger to buy until the next resistance region.
#XRPUSD 1st Aug Looking for one more move higherBINANCE:XRPUSD Looking for one more push to higher, and bullish as far as IV is intact. Any rally should find buyers in 3-7 swings and reach one more high minium.

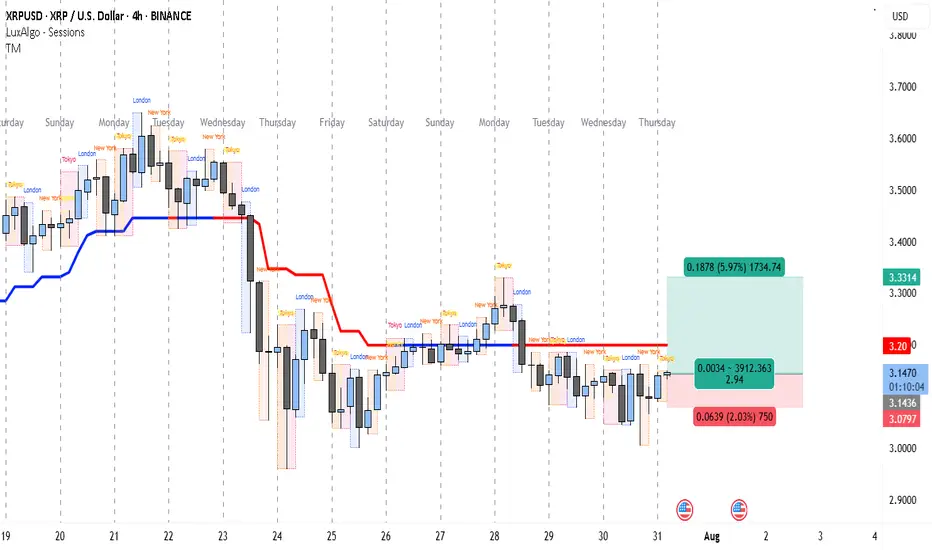
XRP’s 1:3 R:R Setup Could Pay Off FastThe 4-hour chart for XRP/USD indicates a market that has been under selling pressure since the sharp drop around July 23rd, where price broke down from the 3.40+ range. Since then, XRP has been struggling to reclaim higher levels, with the red trend indicator line (likely a moving average or trend-follow tool) acting as a persistent dynamic resistance.
After bottoming near the 3.05 zone on July 25th, the price moved into a sideways consolidation, repeatedly testing both the lower range (around 3.08) and upper range (around 3.20). This tight range suggests accumulation or distribution ahead of a bigger move.
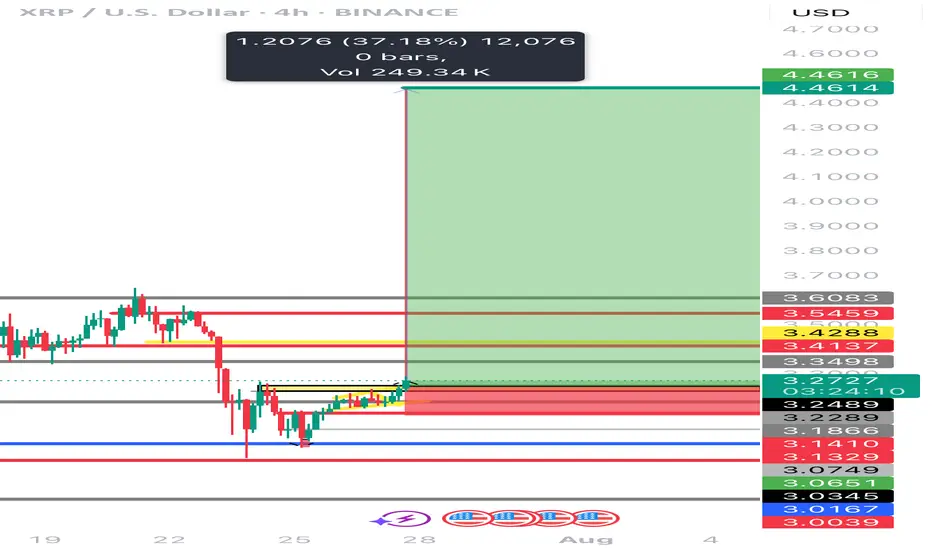
Currently, the chart shows a potential long setup triggered around 3.1450, with a stop loss just below 3.0797 and a take profit target at 3.3314. This setup aims to capture a breakout from the consolidation zone toward the previous resistance area just below 3.35. The risk-to-reward ratio is favorable (close to 1:3), making it an attractive trade for short-term swing traders.
The target level aligns with the price area before the breakdown on July 23rd, where sellers previously gained control. Breaking through that level could signal a short-term trend reversal. However, the price still needs to clear the 3.20 resistance with a strong candle close to confirm bullish momentum.
Trade Setup
• Entry: 3.1450 (current level, inside consolidation support)
• Stop Loss: 3.0797 (below recent swing low)
• Take Profit: 3.3314 (prior resistance zone)
• Risk-to-Reward Ratio: ~1:2.94
• Trade Bias: Short-term long aiming for breakout from consolidation
XRP Long!The setup looks solid! On the Daily timeframe, we’re likely seeing the formation of the final leg up. If this structure holds, we could be eyeing new all-time highs in the coming days to weeks. All indicators are aligned for a strong move ahead. Stay tuned for potential breakouts!
my analysis is not based on this i was just bored but moreso its based fundamentally on EMAS, and potential shifts I am anticipating.

XRP UpdateJust simple analysis, base on breakout line. Hope it will retrace to the blue arrow.
Anyways, do you own analysis and research as well.
☺️

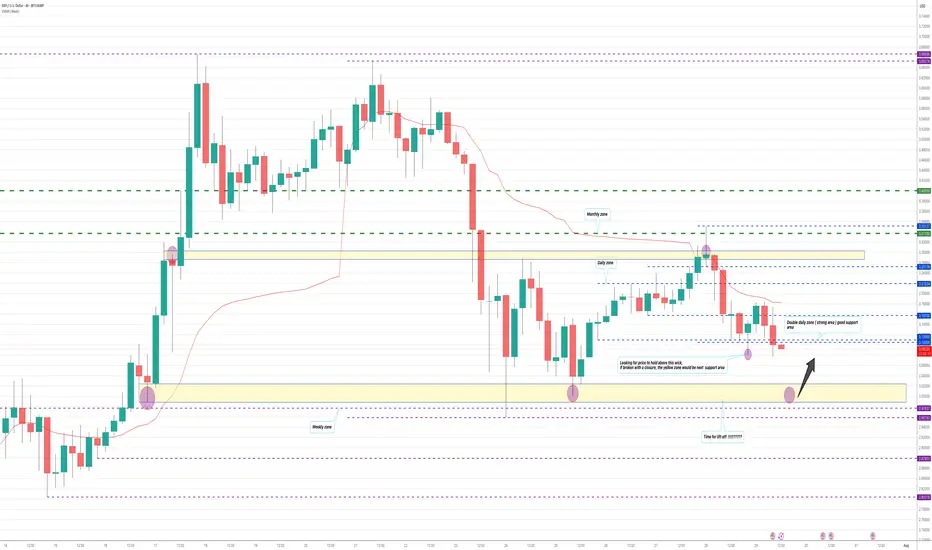
XRPUSD Chart Outlook It's nice to finally say we made it back to the All Time High. Here is what I can see with the current movement we have. It's holding nicely above the double daily but there could be a chance to bottom at the 3.00 to 3.02 range. then push out strong. We have a monthly closure this week & normally we can get some movement at the end of months. just depends. I trade wicks so my zones are on the wicks of previous candle closure, if that helps understand my chart. Happy Tuesday