Back to $4 - XRP weekly update August 7 - 13thXRP is currently advancing within a Minor Wave 3, which forms part of an Intermediate Wave 5 — itself completing a larger Primary Wave 1. This alignment across multiple degrees of trend suggests that XRP may be in the early stages of a broader bullish cycle with meaningful upside potential. The structure of the preceding Intermediate Wave 3 is clearly impulsive, which supports the idea of sustained continuation.
There is, however, some ambiguity in the early part of this current impulse — particularly in the development of Minor Wave 1. This leaves room for an alternative scenario that assumes a more complex correction may still be in progress. This would only be confirmed if the Wave 4 low is breached, thereby invalidating the current impulsive count.
Sentiment and market data currently favour the bullish outlook. Funding rates are positive, showing that the market is leaning long, and open interest is rising, indicating increased trader participation. Furthermore, the liquidity heatmap shows a notable cluster of liquidity above current price, which could serve as a magnet during a third wave — typically the most dynamic part of an impulsive move.
On a broader level, this anticipated momentum could also be fueled by macroeconomic developments. For much of the year, capital inflows into crypto were restricted by the Federal Reserve’s reluctance to lower interest rates. However, that could change soon: according to the CME Group’s FedWatch Tool, there’s a 93.6% probability of a rate cut at the upcoming FOMC meeting in September. Markets tend to front-run such events, and this expectation could trigger renewed retail buying — precisely the kind of sentiment shift that often fuels Wave 3 advances.
Importantly, institutional players appear to have already positioned themselves earlier, as evidenced by the formation of order blocks near the end of Wave 2. This suggests that what we’re witnessing now may be retail-driven momentum building on top of smart money accumulation — a classic dynamic in developing third waves.
As long as the current structure remains intact and the Wave 4 low holds, XRP is well-positioned for further upside — with the $3.50–$3.88 zone as a near-term target. The technicals, sentiment, liquidity positioning, and macro backdrop all point in the same direction: higher.
XRPUSD trade ideas

XRP/USD Long Setup – Bullish Bounce from Key Demand Zone!XRP is showing early signs of a bullish reversal after a strong rejection from the $2.74–$2.90 demand zone. Price has started to push upward, forming a higher low structure on the 4H timeframe, suggesting a possible continuation toward higher levels.
🔍 Technical Breakdown:
Demand Zone (Support): $2.74 – $2.90 (Strong buy zone highlighted in orange)
Current Price: $2.987 (Trading above the demand zone with higher lows forming)
First Target (TP1): $3.231 (key structure resistance)
Second Target (TP2): $3.549 (supply zone where previous selloff began)
✅ Bullish Confluences:
Price bounced cleanly from demand zone
Bullish market structure with higher low
Visible volume support at current levels (LuxAlgo VRVP)
Room to move into imbalance above
📌 Trade Setup:
If momentum continues and XRP holds above $2.90:
Entry Zone: $2.95 – $3.00 (current level)
SL: Below $2.74 (beneath demand zone)
TP1: $3.231
TP2: $3.549
🧠 Notes:
Break and close above $3.231 would open the path to higher levels
Watch for consolidation before breakout
Supply zone at $3.549 is significant — partial TP is wise
🟢 Bias: Bullish

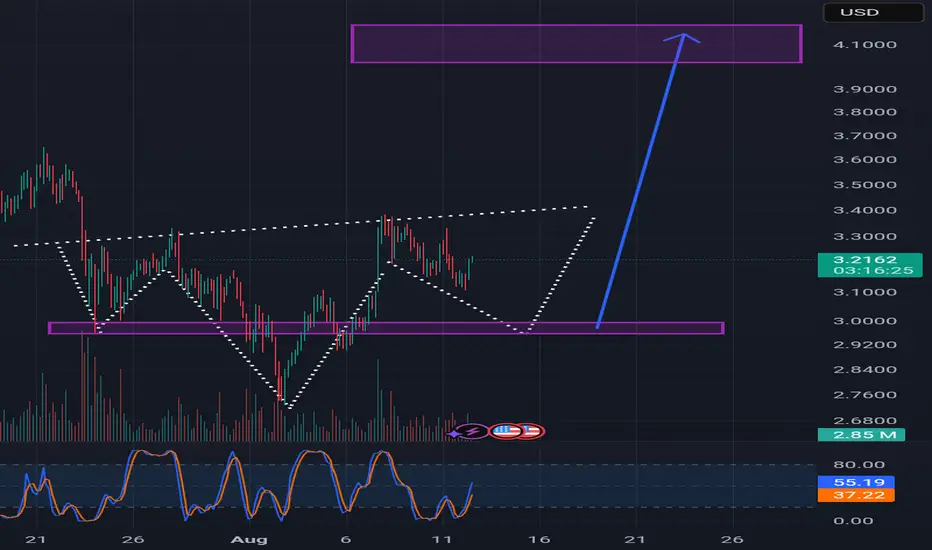
Ripple (XRP/USDT) – $4 Breakout in SightTrend:
XRP remains in a strong uptrend on both Daily and 4H timeframes.
Price is holding above 50 EMA and 200 EMA, confirming bullish structure.
Pattern:
Ascending triangle forming with resistance at \$3.50.
Higher lows indicate aggressive buying pressure.
Breakout target from the pattern projects toward \$4.00 – \$4.20.
Key Levels:
Support: \$3.15 – \$3.20 (major demand zone)
Resistance: \$3.50, then \$4.00
Breakout Trigger: \$3.50 (4H close with strong volume)
Indicators:
RSI in bullish territory (above 60) but not overbought.
MACD showing steady bullish momentum.
Volume spikes align with upswings, suggesting institutional buying.
Trade Plan:
Entry (Breakout): \$3.50 – \$3.55 on 15m/1H close above resistance with volume.
Stop-loss: \$3.25 (below last higher low)
TP1: \$4.00
TP2: \$4.20 – \$4.30 (extended breakout target)
Bias: Bullish while price remains above \$3.25 support.
📈 XRP is coiling just below multi-month resistance. A confirmed breakout above \$3.50 could open the door to a fast rally toward \$4.00 and beyond.

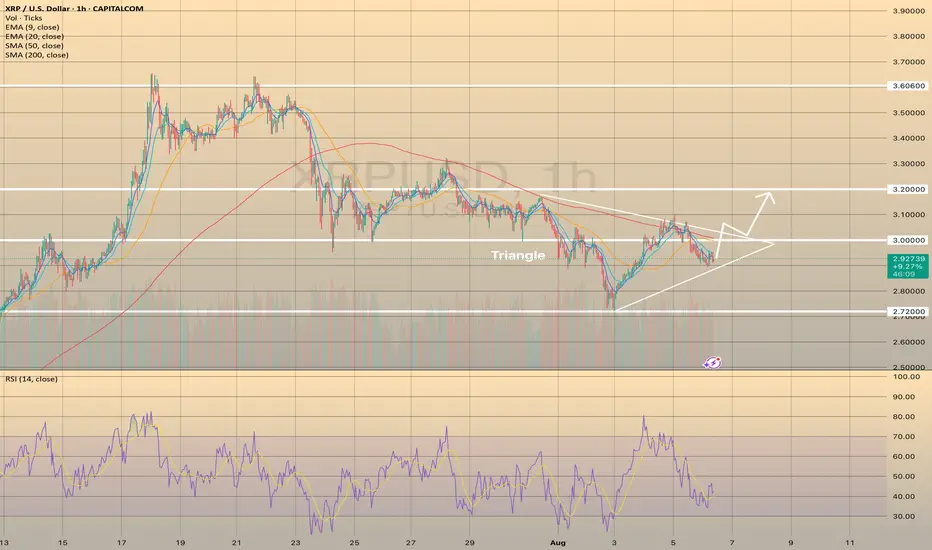
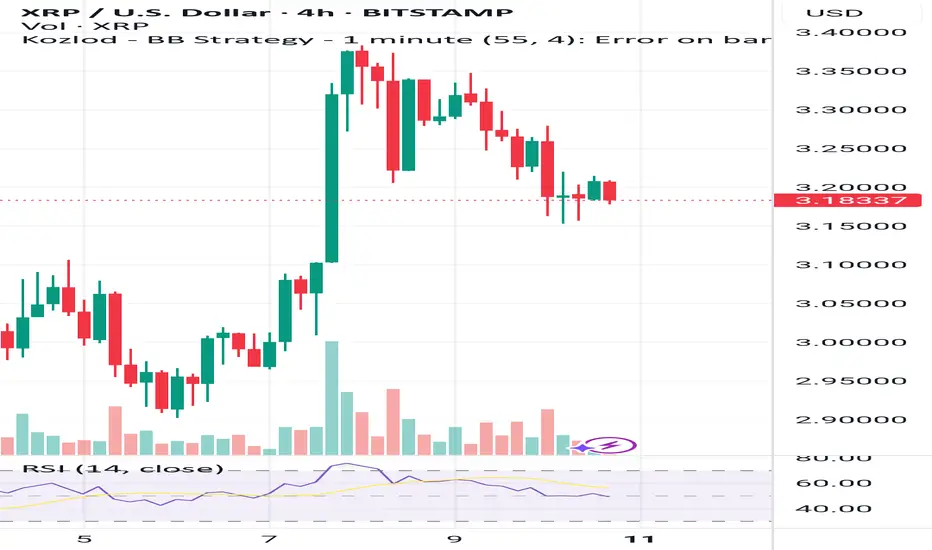
XRPUSD formed the Triangle pattern. The price may increase.XRPUSD formed the Triangle pattern. The price may increase.
XRPUSD has been declining since July 23, reaching the lowest mark at 2.72000 on August 3. Since then the price started to form the triangle pattern. It is not a reversal chart pattern, however, RSI indicator started to show some strength of the bullish momentum. In this case, if the price breaks through the SMA200 on hourly chart and holds above it and the level of 3.00000, the following rise towards 3.20000 is expected.
Would I be even close? I'm still learning Hello, I'm not doing this as someone who knows what they are doing right, as I'm still learning. I'm publishing my idea to see if I'm even close to seeing the possible correct path . And please if I'm incorrect,let me know, this seems to be the only way I learn.
So if this inverted head and shoulder plays out, we would be looking at a completion of shoulder around the lower rectangle and would look to complete upper rectangle. I know I'm not using proper words or even exact measurements areas. I appreciate any feedback back
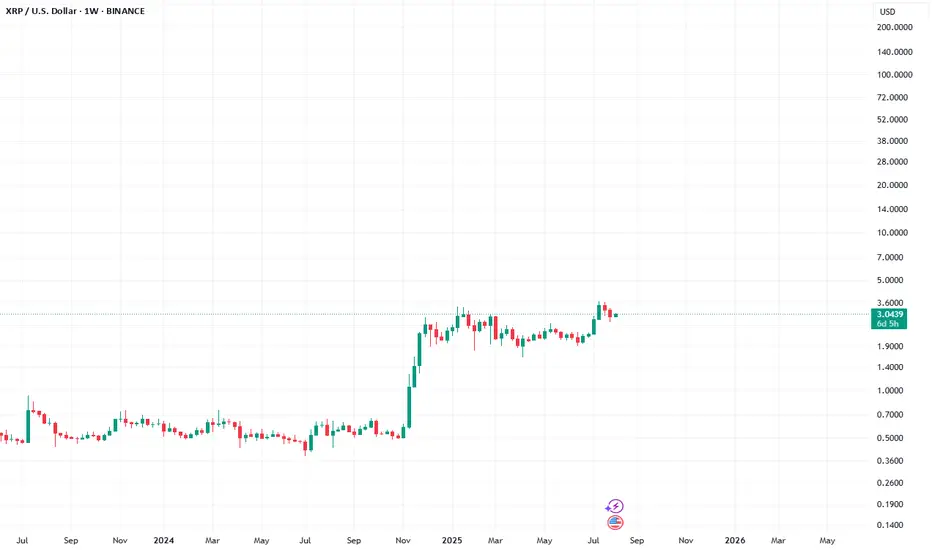
Can XRP hit 10$ in 2025 ?Can XRP hit 10$ ???
if you see this XRP CRYPTOCAP:XRP chart, all 12 years of history, you can see simple & clean,
12 years ago XRP price was 0.00286$ only, and recentl XRP created ATH 3.66$
in 2017 XRP Price 0.003$ and from there XRP Showing big Rally
The past 8 years 1,22,000% price increase
i'm highly confident we can see 10$ mark as well,
The next target is already mentioned in the chart, along with price details.
Share with others and follow now @GlobalRashid for more content like this.

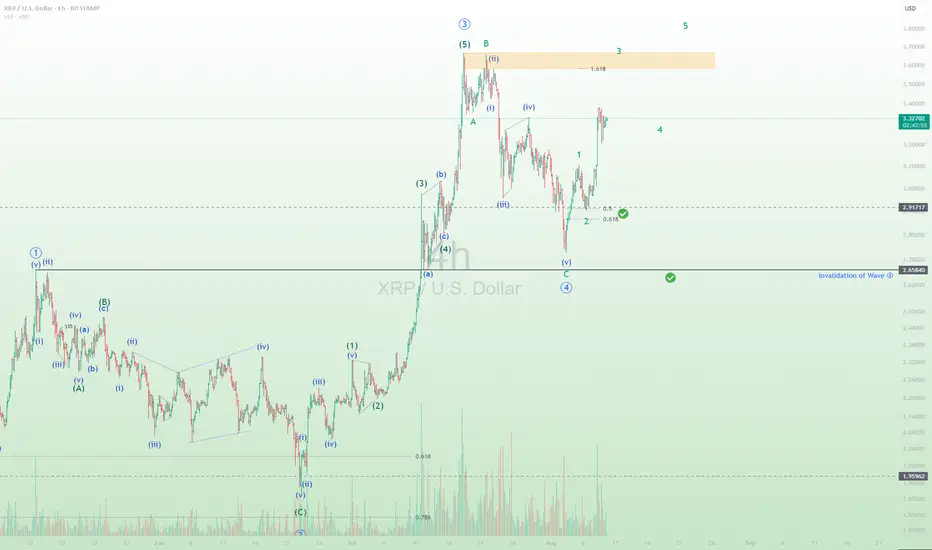
XRPUSD is going for Wave 3Trend: Uptrend continuation.
The price already completed wave 2 at 50% retracement and now continues her journey to wave 3 in 5 subwaves. The minimum target of Wave 3 is near the resistance level of the previous high, as shown in the chart.
This is only my perspective of EW counting for XRPUSD. Not recommended to trade based on my perspective, as it may be wrong. Advice: Do your own TA prior to trade.
THERE CAN ONLY BE ONE – THE STANDARDXRP is ready for takeoff.
On the 6W chart, a low was created at $1.61. Price broke above $3.39 and is moving back toward the 2025 high at $3.66.
I don’t think people are ready for what’s about to happen. XRP has always been the token that outperformed Bitcoin — yet it’s still nowhere near Bitcoin’s price… for now.
I remember years ago, Jimmy Vallee from Valhil Capital said XRP could reach $35K–$50K. With Ripple’s massive global banking partnerships, their invitation to the White House, and their victory over the SEC lawsuit — XRP is the most battle-tested and credible token out there. It’s been through the fire and came out shining.
The days of buying XRP at $0.20 or $0.50 are gone.
I still think we’re at a comfortable price right now, but once it gets past $100 — congratulations to those who held through the storms.
I don’t need courses. I don’t need mentors. I don’t need paid signals or groups. I’ve reached a point in my trading career where I just know. Now, I’m on a mission to execute everything I’ve worked hard for over the last 11 years — to silence every doubter and naysayer. This is a mission for myself, my self-worth. Just me and the markets, closing out the noise, locked in on the goal.
The #XRParmy is here to stay. 🚀

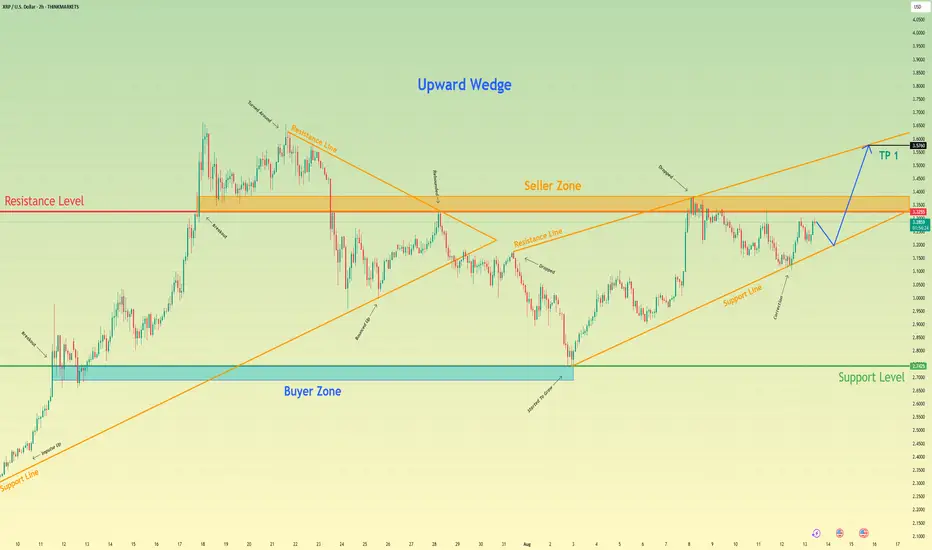
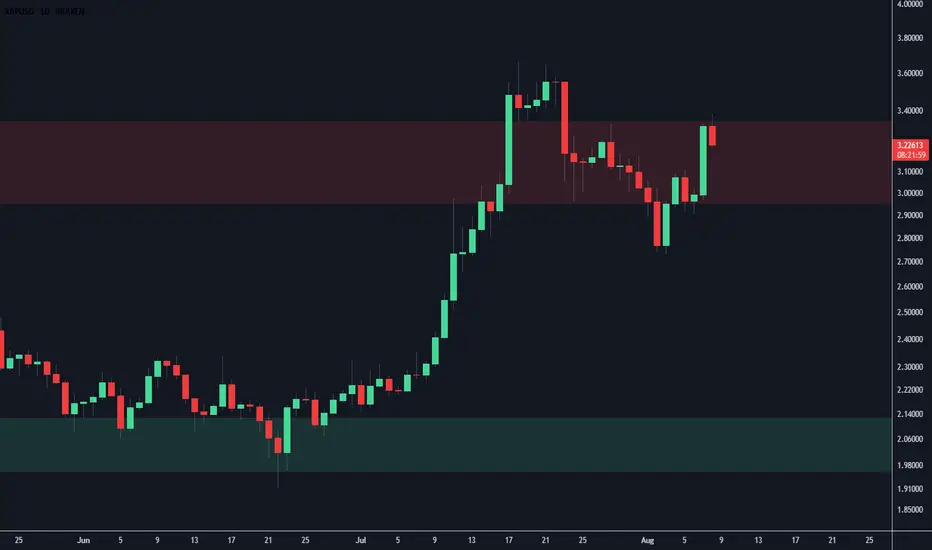
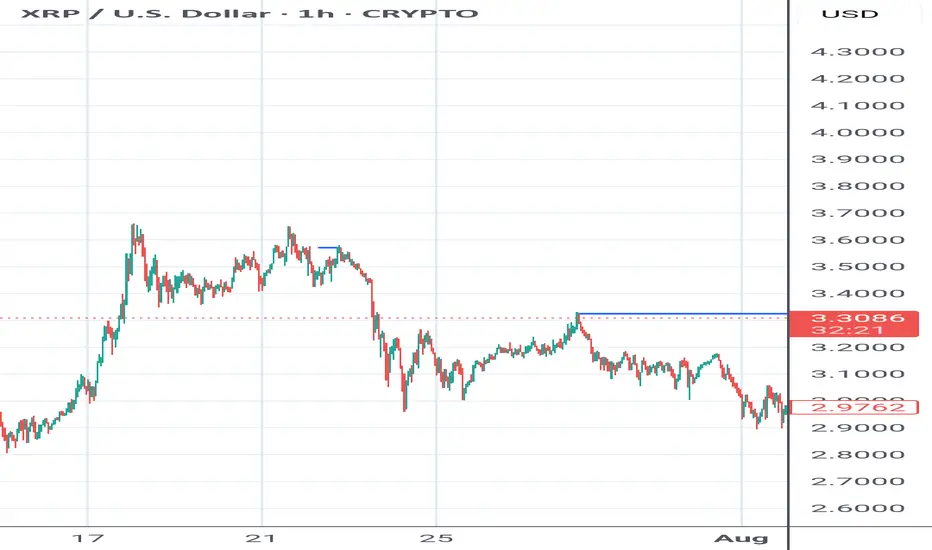
Ripple will continue to grow in wedge and break resistance levelHello traders, I want share with you my opinion about Ripple. The price action for Ripple has been methodically developing within the confines of a large upward wedge. This pattern has defined its strong upward trend since the last major rebound from the buyer zone around 2.7425. This structure has guided the asset higher through a series of corrections and upward rebounds, showcasing a sustained campaign by buyers. Currently, the price is at a critical juncture, consolidating directly below the significant horizontal resistance level at 3.3255. This level, which is also a major seller zone, has previously capped rallies and represents the most immediate obstacle to a continuation of the uptrend. The primary working hypothesis is a long scenario, based on the expectation of a decisive breakout above this resistance. Such a breakout would signify that buyers have absorbed the available supply and are ready to push the market to a new high. The scenario anticipates that following the initial break, the price will perform a corrective retest of the 3.3255 level, treating the former resistance as new support. A confirmed bounce from this retest would validate the breakout and provide the impetus for the next impulsive wave higher. Therefore, the TP for this continuation move is logically placed at the 3.5760 level, which aligns perfectly with the upper resistance line of the entire upward wedge formation. Please share this idea with your friends and click Boost 🚀
Disclaimer: As part of ThinkMarkets’ Influencer Program, I am sponsored to share and publish their charts in my analysis.
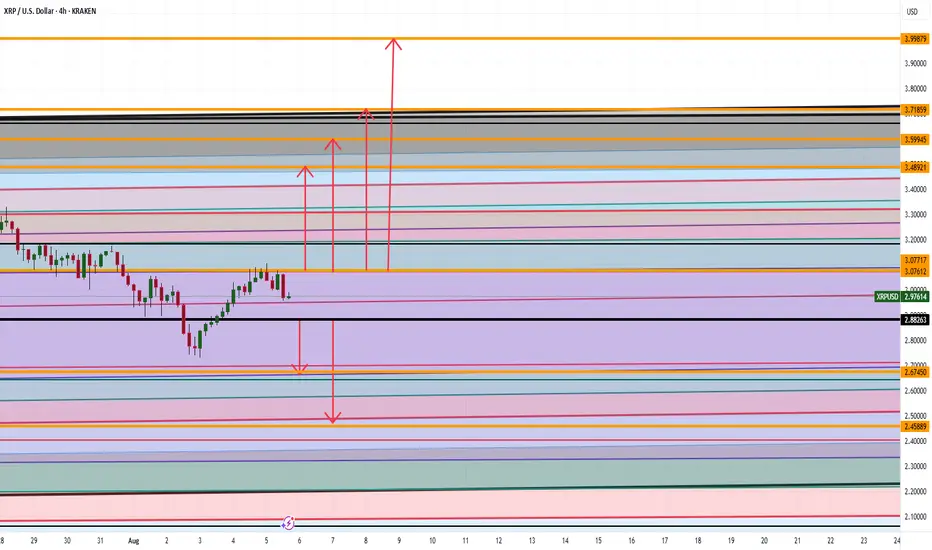
XRP ARE WE GOING TO $4 ANALYSIS Good afternoon
So looking at XRP we can spot a couple things :
Bullish Side: If we can break the high at 3.07 then 3.48,3.59,3.71, and 3.99 makes sense
Bearish Side: If we go below 2.88 then a drop down to 2.67 then 2.45 makes sense
Trade Smarter Live Better
Kris
All in XRPRegulatory Shift: Barriers for Ripple and XRP are easing, clearing the path for dominance in crypto/blockchain markets.
End of Retail Bubble: The retail-driven crypto era is fading, with institutional players paving the way for entry.
XRP ETF Progress: Eight XRP spot ETF applications from major funds await SEC approval, expected within months.
Ripple Lawsuit Nearing End : Resolution is imminent, setting a precedent for other crypto projects.
Blockchain as Infrastructure: The new U.S. Treasury Secretary and SEC Director recognize blockchain as critical national infrastructure, comparable to railroads and the internet in its transformative potential. This perspective aligns with the rhetoric of global financial authorities like the IMF, BIS, and WEF, as well as leading consulting firms, which have championed blockchain’s role in revolutionizing finance and cross-border transactions over the past few years.
Market Trends : Stablecoins, CBDCs, tokenization, and cross-border payments will drive growth, settling on public blockchains.
XRP’s Advantage : Stress-tested by global banks and governments for over a decade, XRP is uniquely equipped for large-scale enterprise adoption. Backed by Ripple, a leading fintech with connected leadership and top talent, XRP leverages unmatched expertise and a global network of bank and payment partners, driving innovation and solidifying its enterprise-grade infrastructure.
Market Performance: Post-election, XRP surged 500%, outperforming all coins, with stop-loss hunting below $3 likely over.
Conclusion and price prediction XRP remains largely unnoticed by mainstream media, its transformative potential yet to resonate with the broader public. Compared to Bitcoin, XRP is still in its infancy as a store of value and speculative asset for retail investors. Yet, as market dynamics shift and critical developments unfold, a potent blend of utility-driven demand and speculative momentum could propel XRP to $10 by the end of 2025. If Ripple’s vision of an Internet of Value takes root—enabling seamless, instant, and low-cost global transactions, capturing a substantial portion of SWIFT’s payment flows, and harnessing the power of tokenization—XRP could emerge as a cornerstone digital asset commodity, potentially soaring to triple-digit valuations by 2030 and fundamentally redefining its role in the global financial ecosystem.
XRP breaking wedge2 for 2 on here now. IH&S went according to plan. Rested on the daily pivot and now its off on good news for their appeal drop.
Now were breaking out of the falling wedge. Next target is 3.56 supply then 3.74, daily r1 pivot.
Watch inflow for support. Could see some shake downs. Remember, this bad boy, and others like it are ONLY MOVED by institutions. Market Makers. You and me, we don't have the capital to drive them one red cent. So, any real quick move was for a reason. And its not for the sake of retail.
Follow for more bangerz

XRP To The Moon and Back! Opportunities Presented.Context 1:
Support: $2.50 to $2.75
Resistance: $3.50
Psychological Levels: $3.00 and $2.50 and $2.00
Context 2:
Technical Structure 1: XRP now in a Bullish Flag Pattern. Resistance tested 6 times and Support tested only once.
FVG’s:
FVG Confluence 1: We have an unmitigated 1H FVG located below price. A 4H FVG almost fully mitigated below price as well.
Golden Pocket (Bullish#1): There is a GP located at psych level $3.00. This aligns with the lower anchored VWAP 50% of the way through the Flag Formation.
Golden Pocket (Bullish#2): There is a major GP located at the bottom of the Bullish Flag Pattern. This aligns with Support at between $2.50 and $2.75.
Golden Pocket (Bearish): A mitigated bearish GP located above price may provide the momentum we need to break through multiple FVG’s to the $3.00 psych level leaving a strong confluence for a sweep of liquidity.
Context 3:
Volume Insight: OBVshows a spike in volume at $3.15. Showing strong confluence to clear lower FVG alignment and sweep liquidity at $2.85 to continue upwards.
BullishScenario #1:
We flush liquidity and mitigate all unresolved orders from $2.75 to $2.85. With the help of our lowered anchored VWAP and an EMA 200 confluence we see a sharp rise to the top of our Bullish Flag Pattern for breakout at $3.25. With a retest of the breakout leading to push price upward to sweep the $3.50 to $3.65 area.
Bearish Scenario #1:
After breaking out of the Flag Patter and sweeping the highs around $3.60, we clear a 4H Rejection Block located inside a Daily Rejection Block. We then test the breakout area creating a Head and Shoulders pattern and close out back inside the Flag Pattern
BullishScenario #2:
After we enter back into the Flag Pattern after sweeping highs, we see a move down to test support a third and final time at the $2.50 psych level. Aligning with the initial bullish move and it’s .618 level along with the bottom of our Flag pattern where we may see a sharp move upwards to create a new support level and ATH.

#XRPUSD Shows incomplete Seq, and its a BUYBINANCE:XRPUSD Currently misses one more swing higher to complete its 5th swing. So we strongly recommended buying this Crypto for one more push higher.

XRP — Weekly Outlook (9–16 Aug 2025)Short-term bias tilts bullish-neutral, with a breakout above $3.42 potentially triggering a rally toward $3.70. On-chain metrics are improving, derivatives remain balanced, and the post-SEC-case momentum is still alive — but all eyes are on the upcoming US CPI release for the next decisive move.
Current Price: $3.32 | Market Cap: ~$197B | 24h Volume: ~$7.5B
📰 Market Context
Regulatory breakthrough — the SEC vs. Ripple case has officially ended with a $125M fine and a ban on direct institutional sales. This removes a major legal overhang while keeping some restrictions in place.
On-chain activity shows XRPL transactions and active accounts (7-day moving average) trending higher compared to June, indicating renewed network usage post-July rally.
Derivatives market remains balanced: Open Interest is steady at ~$3.4B with only ±1% daily change. Funding rates are slightly positive at +0.01%, showing mild bullish sentiment but no overextension. Liquidations in the last 24h are ~$15–16M — within normal range.
📊 Technical Levels
Main support is at $3.15 (20-day MA). If that breaks, next supports are $3.05–$2.95, then $2.70.
Immediate resistance is $3.40–$3.42; a breakout here could open the path to $3.60–$3.66.
RSI (14D) is between 55–62, suggesting moderate bullish momentum. MA-20 sits at $3.15, MA-50 at $2.61.
📅 Key Macro Event
The US CPI report for July will be released on 12 Aug 2025 at 12:30 UTC. Expect volatility as inflation surprises can shift USD strength and global risk appetite.
📈 Weekly Scenarios
Base (55%) Consolidation — consolidation between $3.15 and $3.42 if price holds above $3.15 with neutral OI and funding.
Bullish (30%) Breakout — breakout above $3.42 on strong volume and a $200–300M rise in OI could push price toward $3.60–$3.70, possibly retesting $3.66.
Bearish (15%) Pullback BITSTAMP:XRPUSD — break and close below $3.15 with rising long liquidations could trigger a move to $2.95–$3.05, and in extreme conditions down to $2.70.
✅ Action Points
Watch for a breakout above $3.42 with confirmation from OI and trading volume.
Track XRPL active accounts and payments — if they rise with price, the move is more likely sustainable.
Consider adjusting leverage or widening stops around CPI release time to handle potential volatility.
💬 My view: Short-term bias is bullish-neutral, with upside potential if $3.42 breaks on strong volume. Macro data and on-chain metrics will determine if the rally can extend.

$XRP Historical Golden Ratio - Weekly Timeframe The Historical Golden Ratio (HGR) is the Fibonacci-based market analysis methodology that I created in 2020 (but really discovered). It identifies critical price inflection points by applying Fibonacci in a very unique and fundamental way. It may appear complex from the outside to new and even experienced technical analysis, but under the hood is a very simple and logically built engine that only has two critical parts really. However, it reveals an underlying structure within markets that appears to be fractal-based and dictated by the Golden Ratio. For the experienced market participant, time behind the wheel will reveal that the driving force behind markets has been in plain sight all along; M = φ * H(t) * e^(k * I(t))

Update on XRPCurrent Price: ~$3.31 (Coinbase USD)
Trend: Bullish continuation after minor retracement from $3.34 high.
Structure Update:
Price is holding above the $3.28–$3.30 intraday support zone.
Strong buying interest continues on dips toward $3.25.
4H EMA trend remains bullish, with volume contracting — often a precursor to another breakout leg.
Key Levels:
Immediate Support: $3.28 → $3.25 → $3.20
Resistance / Targets:
TP1: $3.38 (break above recent high)
TP2: $3.50 (major breakout level)
TP3: $3.72 (measured move from last breakout zone)
Stretch Target: $4.00 psychological barrier
Trade Idea:
Entry Zone: $3.28–$3.30 (scaling in if price stays above $3.25)
Stop-loss: Close below $3.20 (breaks short-term structure)
Targets: TP1 $3.38 → TP2 $3.50 → TP3 $3.72 → Stretch $4.00
Bias: Bullish above $3.25; watch for increasing volume on any push above $3.34 for confirmation.
📌 A clean 4H close above $3.34 will likely trigger the next upside push toward $3.50 and above.

STRONG BUY | XRPStrategy: Impulse Correction
Direction: Bullish
Moving Average: Blue above Red
Fib Retracement: 38.2 reached
Support : Finding additional confluence, as the weekly bounces off a massive support structure
MACD > 0
1st Target = 3.66
2nd Target = 4.12
3rd Target = 4.71
Entry: 3.27
SL: 3.12
Lots: 0.08 (Plan to pyramid into this one)
Trade 5/20

XRP:Bullish Momentum Building–What’s Next in the Next 48 Hours?🚀 BITSTAMP:XRPUSD XRP’s technical setup is flashing bullish signals in the short term. While oscillators remain mostly neutral, moving averages show strong upward momentum. This combination suggests a higher probability of steady gains or a positive consolidation phase over the next two days – as long as no major negative news disrupts the market.
📊 Technical Overview
Summary: 14 Buy vs 2 Sell – overall bullish bias.
Moving Averages: Strong support for further upside (13 Buy, 1 Neutral, 1 Sell).
Oscillators (RSI, MACD, CCI): Mostly neutral, indicating no overbought or oversold conditions.
RSI (14): 56.58 – balanced, with room for further upward movement.
🔍 What This Means
The market appears primed for a +1% to +4% move upward or sideways bullish action in the next 48 hours.
Bullish Scenario: A breakout above the nearest resistance level could accelerate gains.
Bearish Scenario: A drop below key support could reverse short-term momentum.
💬 Do you think XRP is gearing up for a breakout, or will we see sideways action before the next big move?
XRP/USDNew chart following the spike.
Currently battling at previous 2 week high around the 3.31 mark. I see a retract back to the 3.11 mark with a return to 3.76 region.
If we are lucky enough to reach the 3.57 mark i am planning to do a healthy profit grab with anticipation of a possible quick drop.
This is my second chart. I have enjoyed learning and observing everyone's charts. I am open to any suggestions on how to improve accuracy.
XRP - The Unpopular Analysis!XRP printed a macro triangle from 2021-2024. Triangles are an Elliot wave pattern resulting in a terminal thrust up in a motif wave before price returns to the bottom of the triangle at $0.28! Now this seems extremely unlikely given whats going on fundamentally but I don't make the rules so don't shoot the messenger!
The motif wave appears to have completed wave 4 bull flag at the $1.6 swing low and wave 5 is underway (which can overextend). Elliot wave count would suggest we are near a major top after one more push up to new highs. More realistic price targets for a deep retracement would be $1.6 again which the ascending weekly 200EMA would catch up to for confluence.
Interested to hear from the other Elliot wave specialists on this count!
Analysis is invalidated below $1.6
New long signals are building in the DEMA PBR and Price Action strategies so keep an eye out on the Trade Signals Substack as we have made very good profits lately in these markets!
Safe trading

XRP/USD – Testing Range Resistance🟢 LONG above $3.1759 – target $3.20+
XRP is trading below the 200 SMA but attempting to reclaim momentum after a range-bound phase. RSI at 53 shows balanced conditions with a slight bullish tilt. A breakout above $3.1759 could spark a push toward $3.20–$3.22.
📊 Keywords: #XRPUSD #RangeBreakout #CryptoLong #AltcoinSetup #TrendShift
