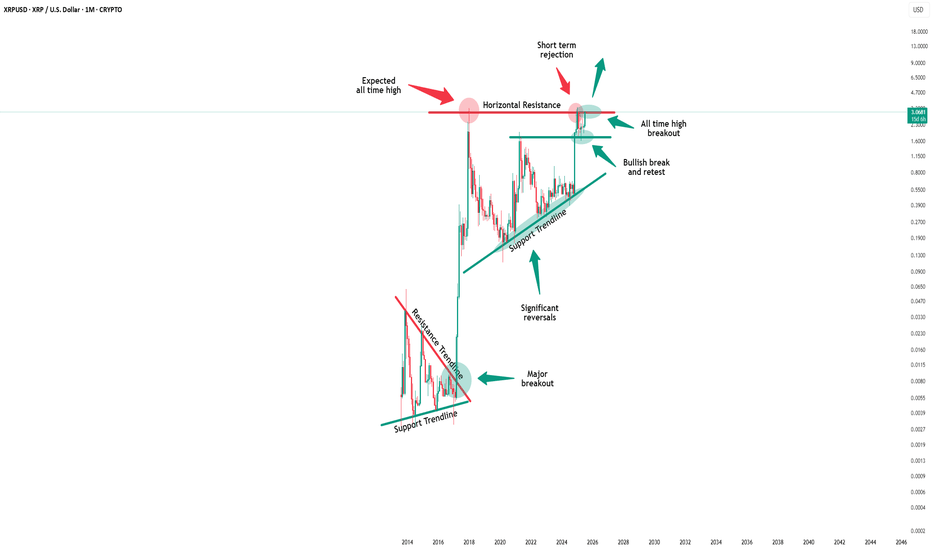
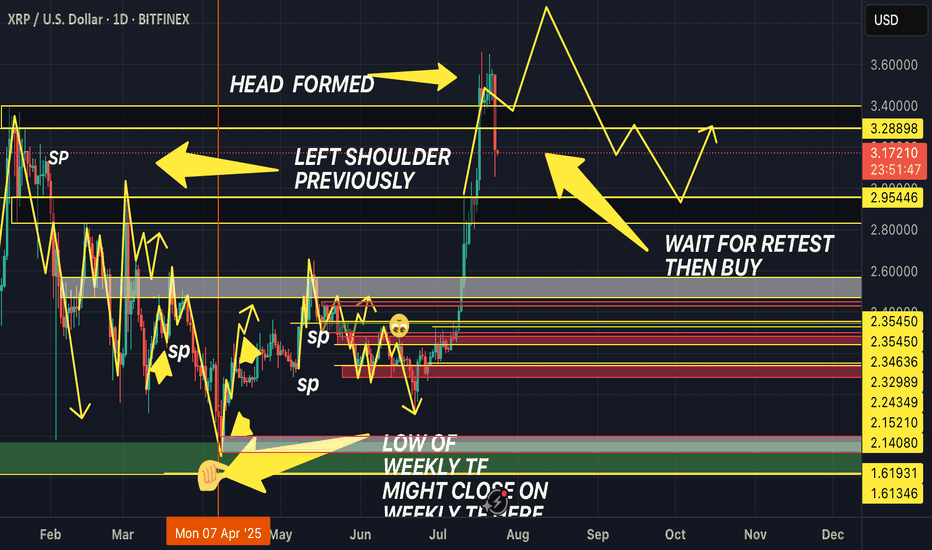
XRPUSD trade ideas
TA: XRP | Wyckoff Pattern Back on TrackSo, here’s the deal—weeks ago I called for a big breakout in XRP based on what looked like a textbook Wyckoff Accumulation pattern. Everything was lining up perfectly: we had the Preliminary Support (PSY), Automatic Rally (AR), Secondary Test (ST), and even a clean Spring. It all screamed “ready for liftoff.” But then… nothing happened.
That bugged me. The pattern looked so good, so why didn’t we break out?
After going back through the chart, I spotted what I missed: there was one last “Test” phase that hadn’t fully played out. This is a common step in Wyckoff where price revisits support to confirm that demand is truly in control. It’s easy to overlook, especially when the rest of the pattern looks complete.
Now that the Test has occurred and held, we’re finally seeing signs of strength again—back on track with Wyckoff expectations.
⸻
🔍 Quick Breakdown of the Chart (See Image Above):
We’re comparing XRP’s current 4H chart with two classic Wyckoff diagrams (bottom right and bottom left). Here’s what we’re seeing:
• PSY (Preliminary Support): Initial stop to the big drop, early buyers step in. ✅
• AR (Automatic Rally): Quick bounce after PSY. ✅
• ST (Secondary Test): Price dips again to test support. ✅
• Spring: The shakeout move—liquidity grab below support before the real move up. ✅
• Test: This is the step I originally missed. Price came back to re-test Spring zone to confirm strength. ✅
• LPS (Last Point of Support): Where price finds a stable footing before trending up. This is what we’re entering now. 🔥
⸻
🚀 What to Expect from Here:
• We’ve likely completed the full Wyckoff Accumulation.
• Price is now forming LPS, a key zone before the markup phase (bullish breakout).
• Next target zones are around $2.50 → $3.00, as marked on the chart.
• If we break those resistance lines, we could see a strong upside continuation.
⸻
💬 Final Thoughts:
It’s easy to get tunnel vision when you’re looking at these patterns—especially something as nuanced as Wyckoff. But this was a good reminder for me (and hopefully you too) that patience and re-checking your work always pays off.
Now that we’ve accounted for the missing Test, I feel way more confident that this move is real.
Let’s see what XRP brings in the next few sessions.
"Ripple" Crypto Heist - Bullish Breakout Plan!🌍 XRPUSD Crypto Heist Plan: Unleash the Thief Trading Style! 🤑💸🚀
Dear Market Mavericks & Crypto Bandits, 🏴☠️
Get ready to pull off the ultimate XRPUSD market heist with our Thief Trading Style, blending razor-sharp technical analysis and cunning fundamental insights! 📊🔥 Our mission? Storm the market, grab those bullish profits, and escape before the Dangerous Red Zone traps us in overbought chaos, consolidation, or a bearish reversal. 💥 Let’s outsmart the market and cash out like legends! 🏆🎉
📈 The Heist Blueprint: Long Entry Strategy
Entry Point 🚪:
The breakout is your signal! Wait for XRPUSD to smash through the Moving Average (MA) at 2.5000—that’s your green light for bullish glory! 🌟
Pro Tip:
Set Buy Stop Orders just above the MA for breakout confirmation.
OR place Buy Limit Orders at the most recent 15M/30M swing low/high for pullback entries.
Set an ALERT on your chart to catch the breakout in action! 🔔
Stop Loss (SL) 🛑:
Breakout traders: Hold off on setting your SL until the breakout confirms. Place it at the recent 4H swing low (2.3000) for swing/day trades.
Risk Management: Adjust SL based on your lot size, risk tolerance, and multiple orders. Play it smart—this is your safety net! ⚠️
Rebels beware: If you stray from the plan, you’re dancing with fire. Own the risk! 🔥
Take Profit (TP) 🎯:
Aim for 2.7500—our golden exit.
Escape Plan: If the market screams overbought or shows reversal signs, get out early! Don’t get caught in the Red Zone trap. 🚨
🧲 Scalpers’ Corner 👀
Scalp LONG only—ride the bullish waves! 🌊
Got big capital? Dive in now. Smaller stack? Join the swing traders for the full heist.
Use Trailing Stop-Loss to lock in gains and protect your loot. 💰
📡 Market Pulse: Why XRPUSD?
The XRPUSD market is in a neutral trend with a high probability of bullish momentum. Here’s the intel driving our heist:
Fundamentals: Dive into macroeconomic data, COT reports, geopolitical events, and news sentiment.
Intermarket Analysis: Watch correlated assets for clues.
Seasonal & Positioning Trends: Align with the market’s rhythm.
Future Targets: Check the Overall Score for a full breakdown! 👉🌏🔗
⚠️ Trading Alert: News & Risk Management 📰
News releases can flip the market like a switch! Protect your positions:
Avoid new trades during high-impact news.
Use Trailing SL to secure profits and minimize losses.
Stay sharp—volatility is our friend, but only if we’re prepared!
💪 Join the Heist & Boost the Plan!
Hit the Boost Button to supercharge our Thief Trading Style and make this heist legendary! 🚀 Every boost strengthens our crew, helping us plunder profits daily with ease. 💥 Let’s dominate the XRPUSD market together! 🤝
Stay tuned for the next heist plan! 🐱👤 Keep your charts locked, your alerts set, and your trading spirit wild. See you in the profits, bandits! 🤑🎉
#ThiefTrading #XRPUSD #CryptoHeist #TradingView #MakeMoney
XRP CLIMBS AND A QUICK TECHNICAL🔥 Hey hey, hope all is well, been a few days and figured I'd chime in and we'd do a quick rundown on our technical and look into how our chart's currently playing out, this shouldn't take too long so feel free to join, thanks.
🔥 Right off the bad we can see how this sort of resistance level formed after we last got that channel rejection in April which ended up pushing us further down and down until bulls were able to break that level and get the much sought after breakout which in turn saw our 20,50 day EMA's finally converge which in turn led us to see bulls taking back that 200 EMA which only boosted things propelling us back up into our ascending channel.
🔥 We already know that ascending channel has been doing a lot for us the last few weeks, so it's fair to see that resistance hit again at $2.4 which in itself is a win considering we we're able to establish a higher high versus our last local high on the 28th in which the highest candle closed out at $2.33 so definitely gonna take this latest pull back up as a bullish win.
🔥 Main thing we'll have to watch for now is the bottom of our channel, we already know we'll likely see some price action start trading within the channel as both sides gear up for another tense battle but all of this is excluding a new exciting development for Ripple which I will get into with the next idea.
🔥 Just wanted to keep this idea simple and technical for our technical traders out there, watch that ascending channel and those EMA's. We've already discussed and focused on the fact that the EMA's are lagging indicators but the fact still stands they can give us good confirmation on the trend and it's direction so definitely keep those eyes peeled.
🔥 I've got to run but thanks for tuning in as always for a quick ta, really appreciate it and definitely keep tuned for that next idea with the new development, excited to post on that when I get back and as always, thanks for the support and let's keep our heads up.
Best regards,
~ Rock '
VWAPs Don't Lie—XRP Faces Judgment Day At Monthly Support
In the volatile world of cryptocurrency trading, technical indicators often serve as critical guideposts for investors seeking to navigate uncertain markets. Among these indicators, the Volume Weighted Average Price (VWAP) has emerged as a powerful tool for assessing market sentiment and potential price movements. For XRP, Ripple's native cryptocurrency, the VWAP is currently telling a compelling story as the digital asset faces a critical juncture at its monthly support level while simultaneously breaking through key resistance barriers.
Understanding VWAP and Its Significance for XRP
The Volume Weighted Average Price represents the ratio of the value traded to total volume traded over a specific time period. Unlike simple moving averages, VWAP gives more weight to price moves that occur on higher volume, providing a more accurate representation of a security's true average price. For traders, VWAP serves as a benchmark that can indicate potential support and resistance levels.
For XRP, the current VWAP analysis reveals a crucial moment in its price trajectory. After months of consolidation following the partial legal victory against the SEC, XRP's price action against its VWAP indicators suggests we're approaching what many analysts are calling a "judgment day" scenario at its monthly support level.
Historically, XRP has respected its monthly VWAP lines with remarkable consistency. When the price falls below this indicator, it often signals sustained downward pressure; conversely, when it trades above the VWAP, bullish momentum typically follows. What makes the current situation particularly compelling is that XRP is simultaneously testing its monthly support while breaking through a key resistance level that has capped its upward movement for weeks.
XRP's Technical Landscape: Breaking Key Resistance
The recent breakthrough above a significant resistance level has generated fresh excitement among XRP investors. This resistance zone, which had repeatedly rejected upward price movements since early this year, finally gave way amid increasing trading volumes and renewed market optimism.
Several factors contributed to this technical breakout:
1. Increased Trading Volume: A substantial surge in trading activity provided the necessary momentum to push through resistance.
2. Improving Market Sentiment: The broader cryptocurrency market has shown signs of recovery, lifting sentiment across most digital assets.
3. Institutional Interest: Reports of increasing institutional accumulation of XRP have bolstered confidence in its long-term prospects.
4. Technical Convergence: Multiple technical indicators, including the Relative Strength Index (RSI) and Moving Average Convergence Divergence (MACD), aligned to signal bullish momentum.
The breakthrough above this key resistance level has opened the path for XRP to potentially test higher price targets. Technical analysts have identified several important levels to watch in the coming weeks, with projections suggesting that XRP could reach significantly higher valuations if the current momentum is sustained.
Monthly Support: The Line in the Sand
While the resistance breakthrough is undoubtedly positive, XRP simultaneously faces a critical test at its monthly support level. This support zone has acted as a reliable floor for XRP prices during previous downturns, and maintaining this level is crucial for preserving bullish momentum.
The monthly VWAP serves as a key component of this support structure. As volumes have increased, the VWAP has begun to flatten and show early signs of turning upward—a potentially bullish signal. However, failure to hold this support could trigger a cascade of selling pressure, potentially erasing recent gains.
Market observers note that this monthly support level coincides with several other technical indicators, creating what traders call a "confluence zone." These areas, where multiple support factors align, often prove to be significant inflection points for price action. For XRP, the current confluence zone represents not just a technical support level but a psychological barrier that could determine market sentiment in the months ahead.
The Ripple Effect: Fundamental Catalysts Behind Price Action
While technical analysis provides valuable insights into potential price movements, fundamental factors continue to influence XRP's market performance. Ripple, the company closely associated with XRP, has maintained progress on several fronts despite ongoing legal challenges.
The company's cross-border payment network, RippleNet, continues to expand its global footprint, with new partnerships announced across financial sectors. These real-world applications provide a foundation for XRP utility beyond speculative trading, potentially supporting long-term value.
Additionally, developments in the regulatory landscape have created both challenges and opportunities. The SEC case against Ripple, which initially caused significant market uncertainty, has evolved in ways that many legal experts interpret as increasingly favorable for Ripple. Court rulings that distinguished XRP sales to institutional investors from sales on secondary markets have provided some regulatory clarity, though final resolutions remain pending.
The combination of expanding real-world utility and potential regulatory clarity has created an environment where technical breakouts may have stronger fundamental support than in previous cycles.
Global Market Context: External Influences on XRP
XRP's price action does not occur in isolation, and global market factors continue to exert significant influence. Several external factors currently impact XRP's technical outlook:
1. Dollar Strength: Fluctuations in the U.S. dollar index have historically shown inverse correlations with cryptocurrency prices, including XRP.
2. Institutional Capital Flows: Shifting patterns in institutional investment have created new dynamics in the cryptocurrency market.
3. Regulatory Developments: Beyond the Ripple case, the broader regulatory environment for cryptocurrencies continues to evolve globally.
4. Correlation with Bitcoin: Despite efforts to establish independent price action, XRP maintains significant correlation with Bitcoin's market movements.
These external factors create a complex backdrop against which the technical battle at XRP's monthly support is playing out. Traders are carefully monitoring these influences for signs of how they might affect XRP's ability to maintain support and extend its recent breakout.
Trading Strategies at the Inflection Point
For traders navigating the current technical landscape, the confluence of monthly support testing and resistance breakout creates both opportunities and risks. Several trading approaches have emerged:
1. Breakout Confirmation Strategy: Some traders are waiting for additional confirmation of the resistance breakout before establishing new positions, looking for sustained trading above the recently broken level with strong volume.
2. Support Bounce Plays: Others are focusing on the monthly support level, planning entries if the price successfully bounces from this zone with convincing volume patterns.
3. Scaling Strategies: More conservative traders are implementing scaling strategies, gradually building positions as technical confirmations emerge.
4. Options and Derivatives Plays: In the derivatives markets, strategies focused on volatility expectations have gained popularity as traders anticipate significant price movement following the resolution of the current technical standoff.
What unifies these varied approaches is recognition of the current juncture's significance. The convergence of monthly VWAP support testing and resistance breakthrough represents a relatively rare technical setup that typically precedes substantial price movement in one direction or another.
Historical Precedents: What Past VWAP Interactions Tell Us
Looking at historical instances where XRP faced similar technical conditions provides valuable context for the current situation. Several notable examples stand out:
In late 2020, XRP successfully defended its monthly VWAP support before beginning a rally that would eventually see prices increase by over 800% in the subsequent months. The successful defense of this support level, combined with increasing volume, preceded one of XRP's most significant bull runs.
Conversely, in May 2021, XRP's failure to maintain its position above the monthly VWAP coincided with a market-wide correction that saw the asset lose over 70% of its value. This historical instance demonstrates the potential downside risk when VWAP support fails.
More recently, in early 2023, XRP tested its monthly VWAP during a period of market uncertainty. The successful defense of this level led to a period of relative price stability before a measured upward movement. This example presents a more moderate outcome possibility for the current situation.
These historical precedents illustrate the range of potential outcomes following interactions with monthly VWAP levels, from dramatic rallies to severe corrections to more measured movements. What they consistently demonstrate is that these interactions tend to precede significant price action rather than continued consolidation.
Fresh Upside Momentum: Targets and Projections
With XRP breaking through key resistance and testing monthly support, attention naturally turns to potential upside targets if bullish momentum continues. Technical analysts have identified several significant levels:
1. Initial Resistance Zone: The first major resistance above current levels sits approximately 20-25% higher, representing previous local highs that briefly capped earlier rally attempts.
2. Psychological Barriers: Beyond technical levels, psychological price points represent important barriers that could temporarily slow momentum as profit-taking occurs.
3. Long-term Technical Targets: Some analysts have identified far more ambitious targets based on larger technical patterns, though these would likely require sustained momentum over a longer timeframe.
It's important to note that these projections assume XRP successfully defends its monthly support level. Failure to maintain this support would invalidate many of these upside targets and potentially trigger downside projections instead.
Volume patterns will be critical in determining whether upside momentum can be sustained. Thus far, volume has shown encouraging signs, with increasing participation during upward price movements—a classic sign of authentic buying pressure rather than technical-driven price action with limited participation.
Risk Factors and Potential Headwinds
Despite the promising technical setup, several risk factors could disrupt XRP's path forward:
1. Legal Uncertainties: Though Ripple has secured some favorable rulings, the ongoing legal case continues to present unpredictable risks.
2. Market Liquidity Concerns: Broader market liquidity conditions could impact XRP's ability to sustain momentum, particularly if institutional investors reduce risk exposure.
3. Technical Invalidation: A decisive break below monthly support would invalidate the bullish case and potentially trigger substantial selling.
4. Competitor Developments: Advances from competing blockchain payment solutions could impact market perception of XRP's utility and long-term value proposition.
Prudent investors acknowledge these risks while assessing the technical opportunity presented by the current setup. Risk management approaches, including clearly defined exit strategies if support fails, remain essential despite the optimistic technical outlook.
Conclusion: Judgment Day for XRP
The confluence of monthly VWAP support testing and key resistance breakthrough has created what many analysts describe as a judgment day scenario for XRP. The resolution of this technical standoff will likely determine the asset's price trajectory for weeks or even months to come.
The VWAP indicator, with its volume-weighted approach to price analysis, has historically provided reliable signals for XRP's major price movements. The current readings suggest we're at a critical inflection point where significant price discovery in one direction or the other appears imminent.
For investors and traders, this technical juncture represents both opportunity and risk. The resistance breakthrough provides a potentially bullish signal, but this outlook remains contingent on successfully defending the monthly support level where the VWAP currently resides.
As volume patterns evolve and price action develops around these key levels, market participants would be wise to remember the maxim that has proven reliable throughout XRP's trading
history: when it comes to identifying genuine market momentum and sustainable price trends, VWAPs don't lie. The coming weeks will reveal whether XRP can transform its technical promise into sustained upward momentum or if support failure will lead to renewed downside pressure.
The judgment day at monthly support has arrived for XRP. The market's verdict awaits.
XRP - JUST A FUN IDEAGood Morning,
Hope all is well. Although I do not believe in predicting the future (At least not long term), I thought it would be fun to evaluate XRP. If, if I was to take into account support and resistance zones, elliott wave theory, price movement levels this is most likely how it would turn out. As you can see XRP is about to finish a large bullish wave which started April, 07, 2025.
We have just experienced a pull-back in which I believe will lead to one more bullish movement upwards before correcting again into a slightly larger pull-back. After this move if we maintain all previous supports it would be highly likely that we hit the 4$ mark.
Buckle up lets see.
Thanks
Weekly trading plan for XRPIn this idea I marked the important levels for this week and considered a few scenarios of price performance
It seems that the price is in a local triangle and if the descending trend line is broken we can expect growth to the resistance zone
Write a comment with your coins & hit the like button and I will make an analysis for you
The author's opinion may differ from yours,
Consider your risks.
Wish you successful trades ! mura
XRPUSD is moving within the 2.3050 - 2.4400 range👀 Possible scenario:
On May 21, XRP price dropped below the \$2.3350 level but has since started recovering and could soon attempt to break above $2.40.
On May 20, the SEC delayed 21Shares’ XRP ETF filing along with at least three other altcoin ETF applications, despite positive regulatory developments. Analysts remain confident the SEC will eventually approve these ETFs, noting that delays are common due to the slow pace of government processes. Despite setbacks, optimism persists as the SEC typically uses its full review period. Bloomberg analyst James Seyffart expects any early approvals by late June or July, but more likely in the fourth quarter when most deadlines occur.
✅Support and Resistance Levels
Now, the support level is located at 2.3050.
Resistance level is now located at 2.4400 .
Calling It Early — Before the Crypto Gurus Even Notice!XRP/USD is giving us that candle retracement setup that I’ve been waiting on. Based on structure, it’s looking like a clean retest of $2.65 is right around the corner. 🔁📊
I’m not basing this off hype. This is pure chart behavior. The candles are showing strength, and the path is looking like it’ll sweep through this key level before pushing higher toward the previous ATH.
This is bullish momentum, not guesswork. You gotta see it to believe it.
🧠 Remember: Most people react to the news.
Smart traders react to the structure.
No doubt at all—
There can only be ONE... XRP the Standard. ⚖️🚀💥
Ripple (XRP) Could Rally If Support HoldsFenzoFx—Ripple (XRP) has extended its downtrend from 2.650 to the key support at 2.30. XRP is currently trading slightly above this level.
The smart money index reads 1.28, matching prior lows where price previously bounced.
Support remains at 2.26. As long as XRP stays above this, a move toward the 2.44 resistance is likely.
Bearish Scenario: A drop below 2.26 would invalidate the bullish outlook, potentially opening the path to 2.06.
XRP/USD – Bullish Reversal in Progress After Wave 5 Completion📊 XRP/USD – Bullish Reversal in Progress After Wave 5 Completion
Timeframe: 1H
Structure: Elliott Wave + Divergence + Break of Structure
Indicators Used: Awesome Oscillator (AO), Fibonacci Retracement, Market Structure
⸻
🧠 Wave Count & Structure Analysis
We’ve just completed a clean 5-wave Elliott impulsive structure to the downside:
• ✅ Wave 1–5 clearly marked with strong bearish momentum
• ✅ Wave (3) and Wave (5) show bullish divergence on the Awesome Oscillator (AO) – a classic sign of weakening bearish momentum and potential reversal
• ✅ Wave (5) completed at the bottom with confluence from price action and AO divergence
⸻
🔁 Break of Structure & Confirmation
• ✅ Break of structure (BoS) occurred at 2.35064, confirming the end of the bearish impulsive wave and the start of a potential ABC corrective phase
• ✅ The BoS also coincides with a dominant structure break, giving higher confidence in the trend shift
⸻
🟦 Current Price Action: ABC Corrective Wave Forming
We’re now in the early stages of a bullish corrective wave (ABC):
• 🔹 Wave A has likely completed
• 🔹 Currently expecting a retracement to form Wave B
• 🔹 Wave C target is projected based on Fibonacci extensions between 1.618 to 1.88, offering a high-probability take-profit zone (TP1)
⸻
🎯 Trade Setup
Pending Buy Entry:
• 📍 Entry Zone: Fibonacci retracement between 0.382 – 0.618 of Wave A
• 🎯 TP1: Fibonacci extension of Wave C between 1.618 – 1.88
• ❗ SL: Just below Wave (5) low or below 0.618 zone, depending on risk tolerance
⸻
🧩 Confluences for Bullish Setup
• ✅ Elliott Wave completion (Wave 5)
• ✅ Bullish Divergence on AO
• ✅ Break of Market Structure (BoS + Dominant BoS)
• ✅ Retracement into Fibonacci golden zone (0.382–0.618)
• ✅ Measured C wave extension to 1.618–1.88
⸻
📝 Summary
The market has shown strong technical signals for a bullish corrective move after a clean Elliott 5-wave completion. With a confirmed divergence, break of structure, and upcoming ABC retracement, this setup offers a solid risk-to-reward opportunity. Watching the buy zone closely for a pending long trigger.
⸻
🔔 Disclaimer:
This is not financial advice. Always conduct your own analysis and manage your risk accordingly.
XRPHighly likely XRP retest $2.20 before moving higher.
Long-term investors are looking for lower prices before a tariff deal with China. A liquidity sweep is needed before we move higher, or we will continue moving lower.
We break $2.50 and we will see $3 quickly after. ETF going Live on the 19th, China deal, SEC case ending will all catapult price.
LOCK IN 🔐
XRP/USD – Still Bullish Despite the Pullback
We’ve seen a temporary rejection at the $2.65 zone, but make no mistake — the macro structure is still intact.
📉 Current price action on the 14D shows a pullback, but zooming out across the 2D and 12H confirms consolidation within the bullish continuation pattern.
🔹 $2.21 is holding
🔹 Trendline from the 20H low remains respected
🔹 No break of structure — just retracement, not reversal
🧠 Most traders get shaken out during pullbacks like this. But if you know structure, you know the game plan stays the same.
#XRP #Ripple #CryptoCharts #TechnicalAnalysis #PullbackNotPanic #BullishMarketStructure #SwingTrading
XRPUSD is moving within the 2.3500 - 2.6000 range👀 Possible scenario:
On May 12, XRP surged past $2.50, reaching a high of $2.6560 before pulling back. Despite dipping below $2.50 on May 13, bulls remain active above $2.40, with the price holding near $2.42. Whale Alert reported a massive 29.5M XRP transfer to Coinbase, worth over GETTEX:73M , suggesting potential sell pressure as the broader crypto rally cools.
XRP briefly overtook USDT on May 12 to become the third-largest crypto by market cap, holding the spot for over an hour before USDT reclaimed it. This surge, fueled by a 100%+ spike in trading volume, followed the SEC’s settlement with Ripple and reflects renewed interest in XRP.
✅Support and Resistance Levels
Support level is now located at 2.3500
Now, the resistance level is located at 2.6000.
XRP Price Showing Support at Key LevelsXRP Price Action Update (Friday)
Chart Overview: We're analyzing the 1-hour chart. The orange lines represent weekly opens over the past few months, which have acted as support levels.
Support and Resistance: The price has consistently found support at key levels, currently holding around the $2.29 range. It's also above the weekly close target of $2.35-$2.36, aiming for the next target around $2.44.
Trend Reversal Potential: If the price can hold above the $2.44 level and move toward $2.59, it would indicate a trend reversal on the weekly chart, moving us out of the current downtrend.
Watch for Retracement: Expect a possible price retracement due to the large value gap. If there's no immediate retracement, it might happen over the weekend before continuing upward.
Break of Structure: The daily chart has shown a break of structure, which is a positive sign. Keep an eye on the key order block for further confirmation.
STOP XRP HYPE! $2.3550 is the first step! I am seeing a lot of social media folks hyping up XRP. I am a big believer in XRP and I do see some crazy prices in the future but right now we need to focus on what is important.
We need a weekly close above $2.3550 before we start even talking about said crazy numbers.
The problem that I see is that we are in a downtrend with a big FVG (Monthly) that is sitting around $1.60 - $0.90. Unless we get some type of crazy news, sub $2.00 is highly likely.
As much as it sucks, I would want the price to clear out all of the sellside liquidity so that we can start shooting up!
Hold strong and do not get shaken out!
XRP Breaks Down from Rising Wedge – Is a Deeper Pullback Coming?XRP has officially broken down from a rising wedge pattern on the daily chart, closing below its lower trendline support. This could signal the beginning of a short-term bearish phase unless key support levels hold up.
Chart Breakdown
On the daily timeframe, XRP was trading within a rising wedge—a pattern typically considered bearish when it breaks to the downside. The breakdown came after price failed to reclaim the $2.30–$2.35 resistance zone, followed by a sharp move lower toward the $2.00 level.
Key technicals:
200-day EMA (blue line) is now acting as the first major support near $2.00
50-day EMA (purple) has turned into resistance
Price is hovering around $2.15, retesting the wedge from below
Bearish Price Targets
With the wedge breakdown confirmed, here are potential downside levels to watch:
$2.00 – Psychological level and strong dynamic support from the 200 EMA
$1.89 – Horizontal support from late March
$1.64–$1.61 – A critical support zone that marked the low before the last rally
If XRP fails to hold above $2.00 and closes below it, momentum could shift strongly in favor of the bears.
Bullish Scenario?
While the pattern suggests bearish momentum, bulls could still regain control if XRP closes back above $2.20 and re-enters the wedge. That would invalidate the breakdown and potentially open the door back toward $2.35 and higher.
Final Thoughts
The wedge breakdown is a warning sign for short-term traders. Unless XRP reclaims key levels quickly, it could be headed toward the $1.89–$1.64 support range. Keep an eye on volume and EMA support—these will likely determine if this is just a dip or the start of a larger correction.