The trend is your friend!Still respecting the trend. Maybe this week a push to the upside of 3.80 maybe 4.00
XRPUSD trade ideas

XRP bearish divergence XRP 4hr showing bearish divergence on RSI as price breaks down from trendline support.

XRPUSD - BEARISH DIVERGENCE DESPITE STRONG BULLISH PRESSUREXRPUSD SIGNALS BEARISH DIVERGENCE DESPITE STRONG BULLISH PRESSURE. WHAT TO EXPECT?👀
Ripple has been moving bullish since July 9, the same as the ETHUSD, reaching the 3.60600 resistance level. Strong bearish divergence on RSI is observed.
What is the bearish divergence?
Bearish divergence is a technical analysis pattern where the price makes higher highs in an uptrend, but a momentum indicator (e.g., RSI, MACD) forms lower highs, signaling weakening bullish momentum and a potential downward reversal. To trade, identify the divergence in a clear uptrend with the indicator showing lower highs (e.g., RSI above 70). Sell or short when the price confirms a reversal (e.g., breaks below a support level or trendline) with increased volume. Set a stop-loss above the recent high. Target the next support level.
Here the closest support level is local support 3.00000. is the price drops below the EMA20 on 4-h chart, there are high chances of reaching this level.

XRPUSD – Trend Bent, Bias BearXRP broke structure on the downside after failing to hold $3.59, slicing through the 200 SMA. Momentum flipped bearish with RSI stuck under 50, signaling distribution phase. Support rests at $3.42. Bulls need a fast reclaim of $3.50 to regain control — until then, lower highs dominate.

$XRPBullish Bias: The chart suggests a bullish outlook with a breakout from a multi-year wedge and Fibonacci targets as high as ~$16.8.
Current Pullback: The price is pulling back after breakout (possibly retesting previous resistance as support).
Risk Area: Orange box shows a potential invalidation or pullback zone before another rally.
Descending Broadening Wedge (Pattern)
A large wedge spans from 2017–2025, marked by two converging black trendlines.
XRP has broken above the wedge (bullish breakout).
Fibonacci Levels (Orange horizontal lines on the right)
0.618: ~$5.91
0.786: ~$17.87
0.88: ~$32.06
These levels are likely drawn from the ATH (All-Time High) to a major low.

XRP 1H Cup and HandleCOINBASE:XRPUSD COINBASE:XRPUSD
On the 1H time frame XRP has broken all time highs to $3.66, then dropped $0.30, forming a perfect cup and handle. XRP is now gaining momentum to break the neckline, heading into to an explosive equal move up to $4.

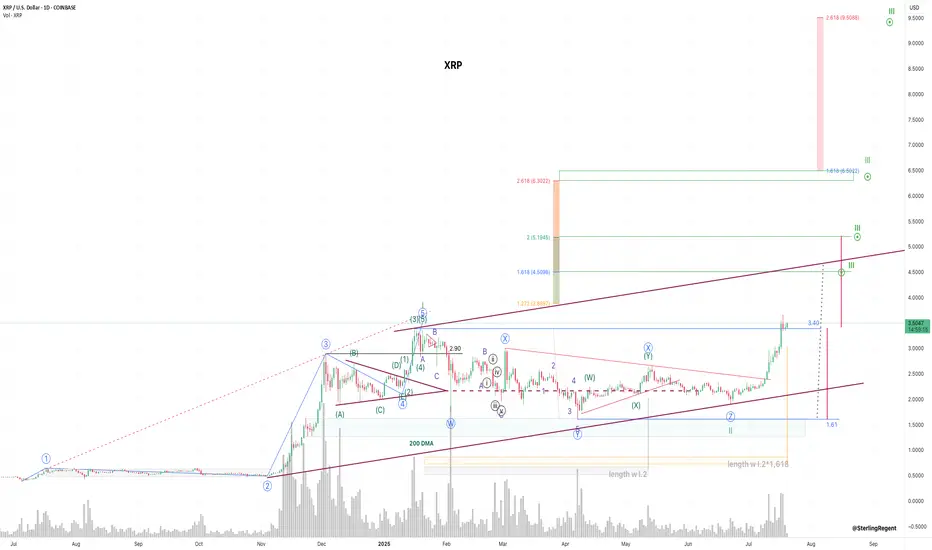
$XRPUSD: Limits of Expansion🏛️ Research Notes
Documenting interconnections where historic area and coordinates of formations are used to express geometry of ongoing cycle.
If we scale out the chart back starting from roughly 2016, we can see more pretext like how the price was wired before decisive breakout from triangle.
Integrating fib channel to the angle of growth phase of the previous super-cycle, so that frequency of reversals match structural narrative.

xrpusd monthlyjust woaw,
who will not like when the chart speaks itself and here it speaks itself
target is very logical, reasonable
we ll see in the future we would be there or not

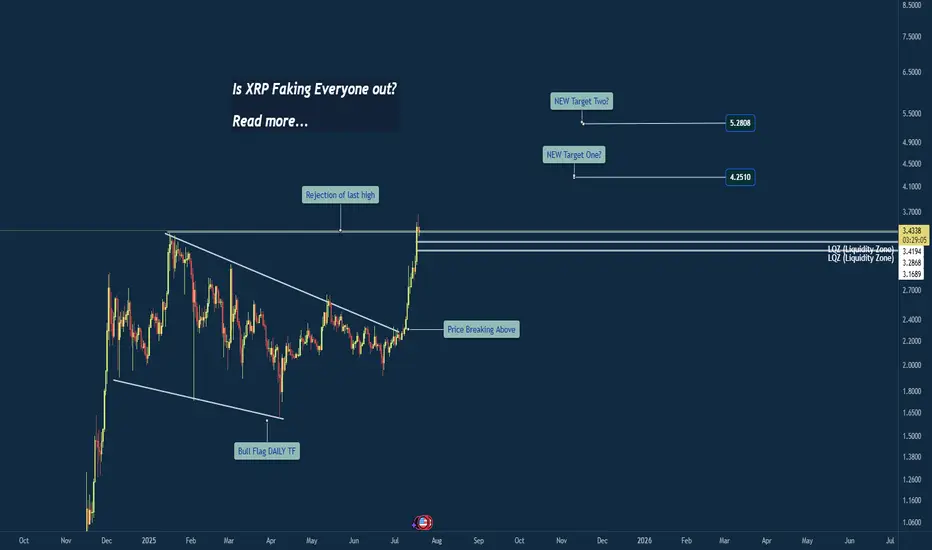
XRP - Ready for Next LegXRP recently made a new all time high at $3.66. But what we are seeing could give credit to even higher highs about to be developed.
What we have seen over the last few days of price action is market structure respecting our old 2025 ATH.
Any dips we have seen have developed lows between $3.30-$3.40. Creating this in to what seems to be a new level of support.
In this post we outlined how that yellow dotted line (key level) would play a role in future price action. So far that is what has happen and we are seeing beautiful market structure develop.
If XRP is to break the $3.66 level we are likely to see a rapid increase in price. Some of the levels that could end up becoming key levels for the future are these:
$3.90
$4.20
$4.50
$5.30

XRP to $10? 🚨 XRP to $10? Here's What No One Is Telling You 💣
XRP is quietly being tested as a global liquidity bridge by BRICS & Gulf nations. If Ripple powers the rails of future CBDCs…
$6.50 to $10 XRP becomes a math problem — not a fantasy.
✅ Ripple IPO incoming
✅ U.S. relisting possible
✅ Token supply shrinking
✅ Wall Street quietly watching
This isn’t hype. It’s the sleeper setup of the decade.
Would you hold XRP if it replaced SWIFT?

Based on real-world utility and institutional integrationXRP is evolving from a speculative asset into a strategic tool for global finance. If Ripple continues to convert partnerships into active XRP usage and ETFs gain traction, XRP could be a strong long-term play. But like all crypto investments, it demands careful risk management and a watchful eye on regulatory shifts
Hex on PulseChain mirrors XRP over time, $0.003 -> $3.40 (5yrs)Attention Poverty Investors 💀
While you were crying about your Hex bags at $0.003, XRP holders were getting absolutely REKT for 4-5 years straight. "Dead project!" they laughed. Then those same clowns FOMO'd in at $3 when XRP went nuclear in 2017.
1,133x gains for the psychopaths who didn't paperhand like little babies.
Now HEX sits at the EXACT same $0.003 graveyard for 5 years. Same high supply. Same "ngmi" energy. Same braindead price action that makes moonboys rage quit.
But here's the thing, anon: Alt-season is coming and history doesn't give a %$@! about your feelings. When high supply coins pump, they pump VIOLENTLY. Ask the XRP OGs who went from eating ramen to driving Lambos.
Translation for smoothbrains:
HEX at $0.003 for 5 years = XRP at $0.003 for 5 years.
If you can't see the pattern, stay poor.
$3.40 HEX incoming? Maybe. Maybe not. But if you're not at least considering it, you're ngmi.
This is not financial advice, it's a reality check for all you $0.003 stablecoin holders 🤡
WAGMI or cope forever. Your choice.

XRP 1H Chart Analysis - Breakout PotentialThe price is currently testing the 0.702 resistance level on the 1H chart, a key zone with historical rejections. A decisive break above 0.702, confirmed by a strong bullish candle and higher volume, could target 1.363. If the price breaks above 1.000 with solid confirmation, XRP might enter price discovery, pushing toward uncharted highs.
Key Levels:
Resistance: 0.702 (current), 1.000 (major), 1.363 (next target)
Support: 0.469, 0.382, 0.236
Strategy:
Enter long on a confirmed break above 0.702, aiming for 1.363, with a stop-loss below 0.469 (1:2 risk-reward).
For a 1.000 breakout, go long with a stop-loss below 0.702, using a trailing stop as prices extend.
Watch for volume spikes to validate moves.
Alerts:
Set an alert at 0.702 for a 1% break above.
Add an alert at 1.000 for a 1% break above to catch price discovery.
Stay cautious of false breakouts and monitor real-time data for confirmation.

XRP consolidation close to done, 10$ next- update on this analysis, made more than half a year ago:
- since then Ripple has been consolidating at a high level
- history doesn´t repeat but it does rhyme is the famous saying - in case of XRP it looks like price action is literally repeating the 2017 playbook with an initial impulse - consolidation - followed by another impulse
- target of the macro triangle pattern is north of 10$ per XRP, likely to get reached by the end of the year

Ripple analysis, long-termAccording to the latest analysis, Ripple's price rose from $0.50 to $2. Further, the price is analyzed to be likely to decrease to the $1 range with a dark $4 and $3.50, which in the long term can be expected to increase Ripple to this price range.
Sasha charkhchian

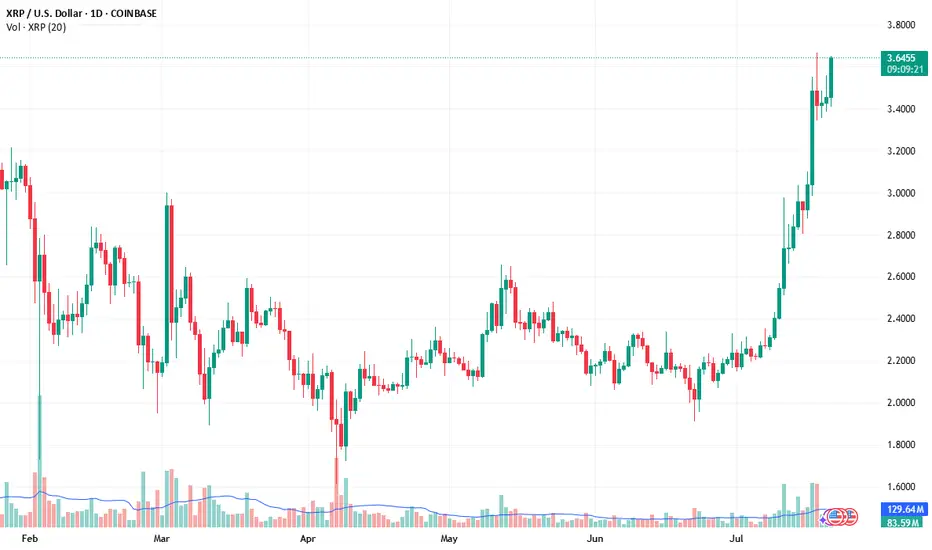
XRP Weekly ChartPrice made new ATHs on Friday went as high as $3.66, taking out the previous high at $3.39.
See if this week closes above, the monthly candle would give a stronger confirmation.
Anything could take price to $5+ or back down to $1.

XRP : KEEP simpleHello there.
Simple chart. XRP will never 3.50 probably again if we look chart. Is this a false breakout ? Just wait the confirmation in Weekly first, and monthly second.
This can be brutal. Like LTC and XLM, CRYPTO dino.. will run the world. I'm not a augur, but we look only the chart.
Good luck... Spot here is very good, you miss all ? Don't worry, you can gain a lot here, and if not, don't worry the life always end.
Good luck

XRP zoomed out - do you see what I see. XRP weekly chart closing above the 5 years old ATH might be signaling extended level. Follow the Fib-extention where to expect it.

XRP will go higher XRP is bullish all i see is bullish; can go higher.
First 4$ , 5$ and then higher and above. Anyone who's holding XRP you will be very rich.

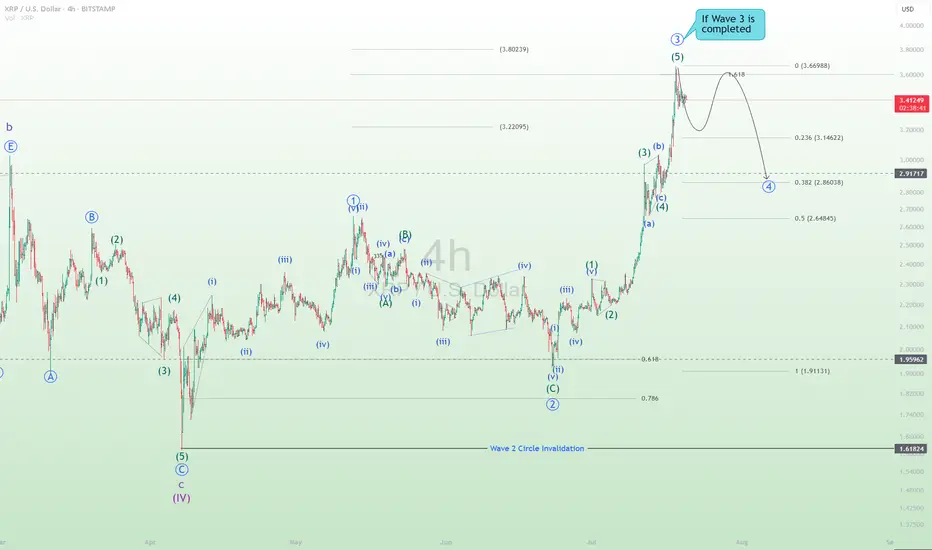
XRPUSD - If Wave 3 is completedNow we see XRPUSD reached the level 1.618, a trader's psychological level for wave 3. If most traders take profit at this level accompanied by big volume, most probably we are going to see a new downtrend of wave A of wave 4.
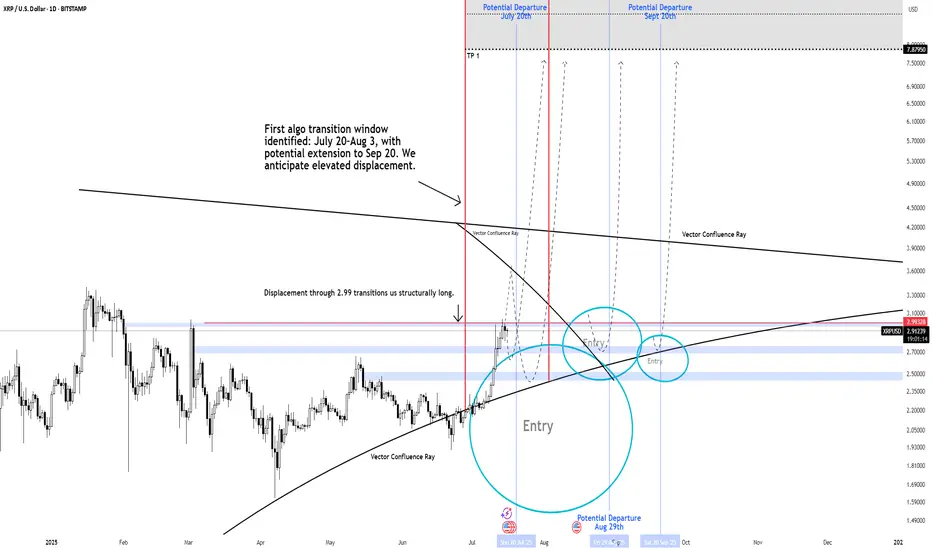
XRP THE $2.99 "NUKE" LEVEL Could Send Price To $30 to $100+ Primary Expansion Window: July 20 – Aug 3, 2025 (potential extension to Sept 20)
XRP is positioned for a structural regime shift. The pivotal $2.99 "nuke" level is on watch a clean break through this price isn't just an ignition, it's the catalyst for explosive directional flow. As algorithms flips long above $2.99, Wave 1 is triggered, opening accelerated risk toward the $30 target during this active expansion window.
Vector Confluence Rays: Dynamic Support/Resistance. order flow and price memory become most active these are potential launch points for expansion or resistance.
Nuke Level ($2.99): The term signals more than a trigger it's the critical inflection where algo's initiate volatility and momentum. When breached, price will accelerate.
What’s Next After Wave 1?
Second Expansion Window: November to December 2025
When momentum and higher timeframe structure persist, a larger breakout framework comes into play with targets of $60, $100, and, in extreme scenarios, $1,500+ if a full structural unlock unfolds.
Key Takeaways
$2.99 is the “nuke” level: The breakout ignition for Wave 1. Algo's are highly likely to accelerate above this line, targeting upwards to $30 within the first expansion window.
Lower probability predictive models do show price can reach $60 Wave 1 in extreme cases.
Expansion windows defined: First window live July–September; second window November–December for further upside potential.
Above $2.99: Upside is highly probable the algo is primed and with years of price suppression means acceleration is very likely once this level breaks.
-Neverwishing
Breakout or Bull Trap? XRP at Critical Weekly LevelWeekly Chart Insight: XRP Closing Above Previous High
XRP has just closed above its previous weekly high—a significant development that could signal a shift in market sentiment. Historically, when price closes above such a critical level on the weekly timeframe, it often leads to continuation, unless a sharp rejection quickly follows.
At this stage, the focus shifts to the 4-hour timeframe for confirmation. An impulsive move above the current consolidation zone could indicate that this breakout is legitimate, potentially leading to another bullish weekly candle.
However, caution is warranted. If the next two daily candles close weakly or fail to maintain structure above the breakout level, it could hint at a fakeout or liquidity grab before a deeper correction.
My Current Bias:
I remain neutral-to-bullish, contingent on:
An impulsive continuation on the 4HR
Strong daily closes above the key range
Price not falling back and closing below the weekly breakout level
If price begins to consolidate and hold this level, that would reinforce the bullish case. But if we see immediate selling pressure and a re-entrance below the breakout, I’ll reconsider the bias based on developing structure.