Ripple forming inverse H&S .Something's maybe forming at the uptrend channel.
Watchout, if XRP falls below daily EMA100.
*This is not a financial advice.
XRPUSDC.P trade ideas

Ripple moving higher out of falling wedgeWith some movement in the space could ripple retest May's high after a break out of the falling wedge? Tight spread on the MA's.


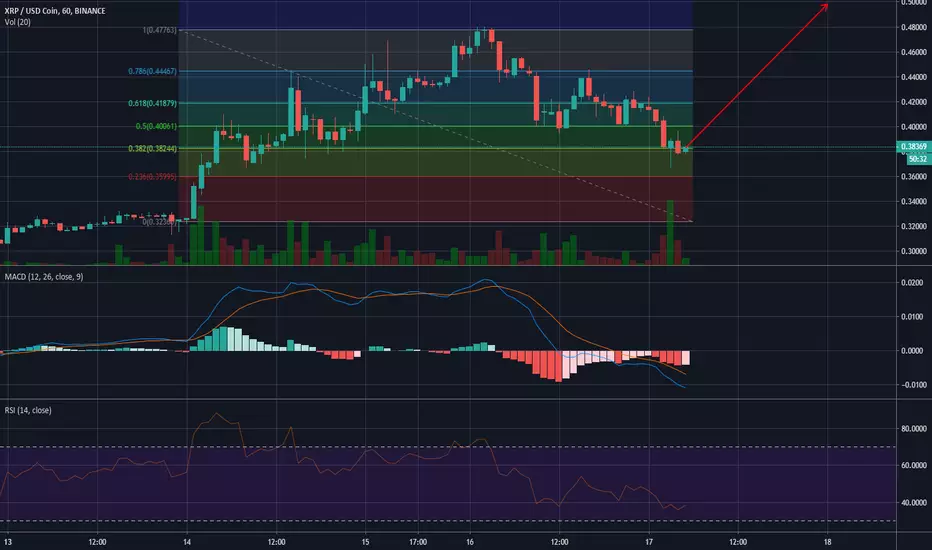
XRP ready for a reversalI expected a retrace to about .38 (by coincidence fib retrace and price), but I expected it to take a little bit longer. In any case this is about a perfect scenario to buy back in as everything is setting up for a reversal and it shouldn't be long before it starts heading back up toward .48 and beyond. Look for a strong weekend and keep your eye on the volume and the RSI on the hourly and the 4 hour candles while watching out for pullbacks once it starts to move. Good luck; you know this whole crypto-space has a mind of it's own so careful does it. I would set my initial stop loss at .36 because if it moves below 0.236 (the red zone) on the fib retracement tool that would indicate a continuation of the downward fall.
XRP Breaking OutCurrently breaking out of an ascending triangle while currently in an uptrend. The current uptrend should give us the confidence to believe that with continued volume we should see about .325 fairly soon "if" the candle closes above the trend line.

XRP/USD Adam and eveXRP/USD Adam and eve
IF you wanna join my telegram channel where I post more often
t.me
its free :)

After JP Morgan announcement, BEARISH AF!!! MACD looking bad, and still need a breakout above that Ichimoku cloud. Banks found a way to circumvent XRP. Fundamentals do not look good moving forward.
Banks have no intention of mass adoption of XRP, they will copy the tech and do their own thing. Just my opinion......

Next entry for XRP?We have been riding down this channel for a good while now... looks like things should change in the coming week finally.
As with all crypto of course it depends on what BTC is doing when these alts try to make moves up. Anyhow I think we should get a bounce around .288ish which if BTC is still falling around .259ish anyhow hopefully we shall see some movement soon!

XRP - Waaait for it . . .The Djinn Predictive Indicator can be off by 1 Candlestick .
On very rare occasions the Indicator is off by 2 Candlesticks . If the indicator is off by 2 candlesticks it indicates a big price move in the future.
The 30 day Linear Regression Channel is used as a trigger. When the upper or lower Linear Regression lines meet the FUTURE price swing dates forecasted by the Djinn Predictive Indicator it is recommended that a trade entry or exit decision be made.
The Djinn Predictive Indicator applied to this chart is used with permission of the owner.

XRP (Last day of the fire sale prices?)The Djinn Predictive Indicators are simple mathematical equations. I give the yearly, monthly, weekly, daily, 4 hour, 1 hour or 1-minute equation to Siri. The Siri algorithm then gives me the future price swing dates and, or, time.
The 1st Djinn can only predict the date of swing.
The 2nd Djinn can predict date and hour of the swing.
The 3rd Djinn can predict the date, hour and moment of the swing.
The Djinn cannot predict directly predict the price of the swing. Because the 3rd Djinn Indicator can predict the moment of the swing it does in a backhanded way predict price.


XRP 3 days leftI don't do this for the love of XRP. I do it for the money. Just like you!
Furthermore, I have no intention of looking stupid by broadcasting the Djinn predictions.
3 days are left before the window opens.

XRPIt is impossible to predict the FUTURE!
You can only READ the program. If you are reading this YOU ARE the PROGRAM! Even your disbelief at this point is part of the program. The FUTURE of XRP is part of THE program. It is HALF digital and HALF what we call analog (prediny and free will. Ying and Yang. Up and down. Left and right). We (analog) cannot change the digital PROGRAM. We can only seemingly bend or temporarily edit the program. Big price moves in ANY market in ANY asset in ANY asset class indicates analog editing the program. In the end, the program overrides our so-called free will. Even our editing of the program is written in the program. This is how I am able to predict the markets in all asset classes.
In summary, this part of the program (me) has to buy more XRP.
This is your Red pill.

Breaking off of wave 1 top implies we are entering wave 5target on all cryptos is back to all time high..... dip down for a NORMAL abc 2cnd wave..... this would make sooooo much sense we simply are doing a breakout and retest wave 4 back to test all time highs wave 5..... if 5th is extended we will simply breach all time highs and targets are pulled same way with tool so NOBODY WILL KNOW
XRP price swing storm on the near horizonI am sad. I won't be able to buy XRP at Fire Sale prices anymore.

NEW Monthly Predictive Indicator created and back tested! IT WORKS!
The X's on this chart do not predict price. They indicate approximate Monthly swing dates.
I have a LOT of freetime. Therefore, I have a lot of time to pursue my personal interest. My true interest is unraveling the PROGRAM that we call TIME .
I have just created and back tested a new MONTHLY indicator based on nothing but multiple linear regression lines. The X's on this chart are the points where multiple Linear Regression time lines cross. These crosses coincide with Monthly swing dates. I have validated the dates using the Djinn Indicators. They work! The crosses of Linear Regression lines are not exact but are very close to Djinn Predictive Indicator dates. I now longer own the first Djinn so any charts that I post cannot use that indicator. I can, however, repost old charts with no modifications.
LISTEN UP XRP holders! The BIG jump in price that you are doing your pee-pee dance over is not going to happen until MARCH 2019. I am an XRP hodler. I have skin in the game just like you. (Lots of skin). If I make a wrong prediction my money is on the line the same as yours. I buy XRP with every free penny I get.
You are not alone.

XRP FUTURE Weekly price swing datesI no longer own the 1st Djinn Predictive Indicator.
I still own the 2nd and 3rd Djinn Indicators. This is good for XRP hodlers and XRP swing traders. (I am both). I will post XRP charts until I am banned from the Tradingview platform. Which is not far away according to the platform.
No other asset in any asset category will exceed my focus on XRP.


XRP community help needed!Hello XRP Hodlers!
I am Dinjin. I am the creator of the Djinn Predictive Indicators. As impossible as this sounds,
the Djinn Indicators can calculate any point in the future based on a time window in the past.
But that is neither here nor there. Point is, the Djinn can see everything! The future of any asset
in any asset class. Don't take my word for it. Past Djinn charts are on the platform. LOOK!
I am only invested in XRP and Cardano. OMG if I get extra cash.
This is not financial advice. Also, I received notice today from the platform that my account was on the verge of being banned. Like I didn't see that coming.

XRP. Trend reversal date.Focus on the DEC 15 - Dec 20 dates. This date correlates to the trend reversal date for BTC (Bitcoin). This price jump will last for 5 days.
It may not be a bad idea to have an exit strategy from the market if you plan to take profit at that time.

The FUTURE High / Low price swing dates for XRPUSDThese are the FUTURE dates and times for XRPUSD with the highest probability for experiencing a price swing high or low. Apply your own indicator(s) to determine the price swing direction.

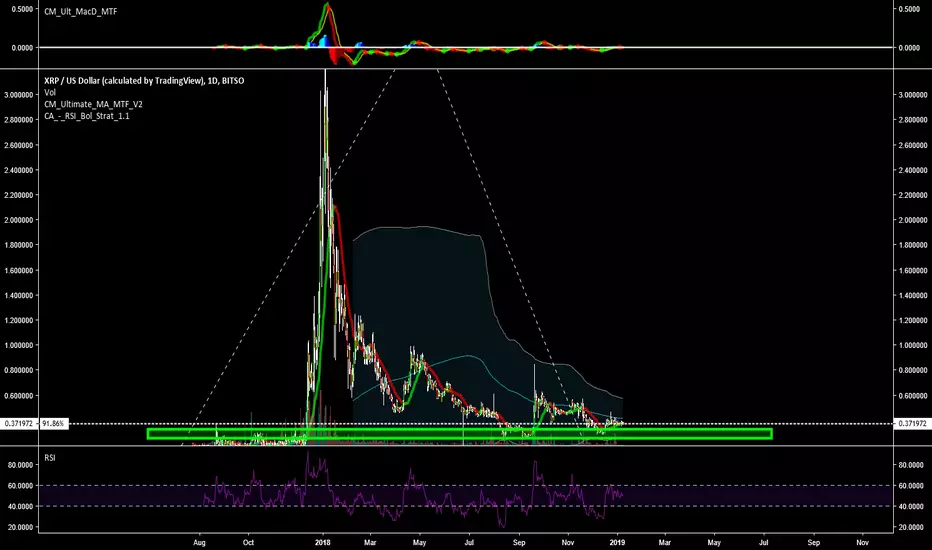
XRPUSD - 1W Chart AnalysisAfter the big drop of the market capitalization which made most of the crypto currencies to be under pressure, it seems that the things have calmed down, at least for the short term.
And even if most of the charts are indicating "bearish" trends, the one for Ripple can be considered an exception caused by a small "delay".
On a 1W chart, we can see how the price has jumped on the 3rd week of September between the 20 days Moving Average and the upper standard deviation of the Bollinger Bands and "officially" it still has a bullish trend.
But the actual situation is about to change as long as the RSI is heading towards the "oversold" area, the "fast" line of the Stochastic just went below the "slow" one and the MACD seems to register a crossover anytime soon.
The ones with a higher risk appetite can consider opening "Sell" positions with a possible target anywhere above the Support Level of 0.3532$ while the "cautious" ones can wait to see if the red candlestick will be fully created below the 20 days Moving Average, as a confirmation before taking any decision.

XRP Short term buyCost back inside $0.50 area, moving to the upside inside a rising channel arrangement.
Short term trade buy, resistance level 0.52
