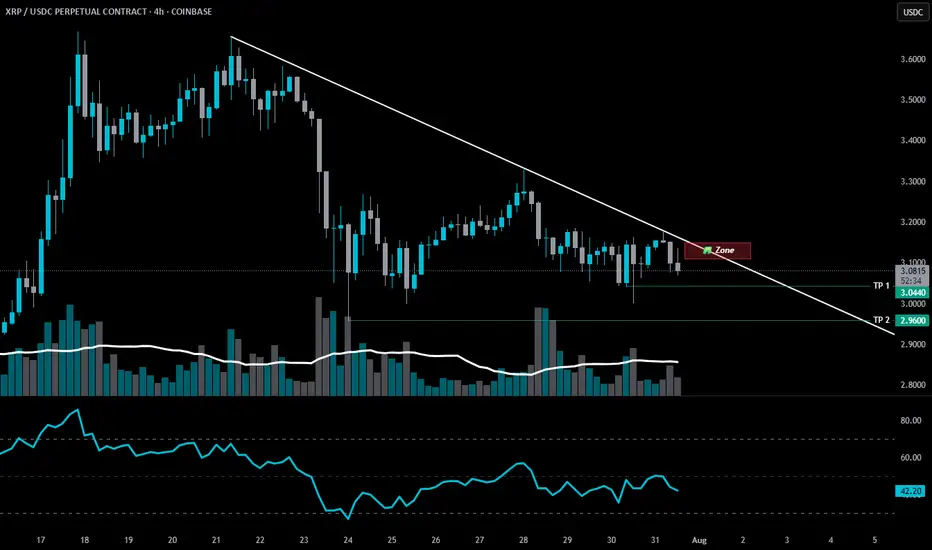
SHORT ZONE-XRP structure shiftThere was an XRP structure shift last week.
📉 It’s been bleeding ever since.
Now, another bearish setup is forming.
If XRP nears that descending trendline and fails to break through — it enters the SHORT ZONE.
🚫 No breakout? No mercy.
This isn’t the end for CRYPTOCAP:XRP — but a purge may be necessary before liftoff.
A proper cleansing to prepare for the next ascension.
🫡 xrpArmy, forgive me…
But hey, feel free to earn your keep.
Stay Sharp. Regulate Yourself.
🚫 100% NOT financial advice.
🎭 Edutainment purpiz only.
XRPUSDC trade ideas
XRP breakout imminent ? We have a huge flag formation since the last breakout months ago. It seems it wants to break to the upside. If it fails, the bottom range is around 1.56$ if the flag is respected. Let's see

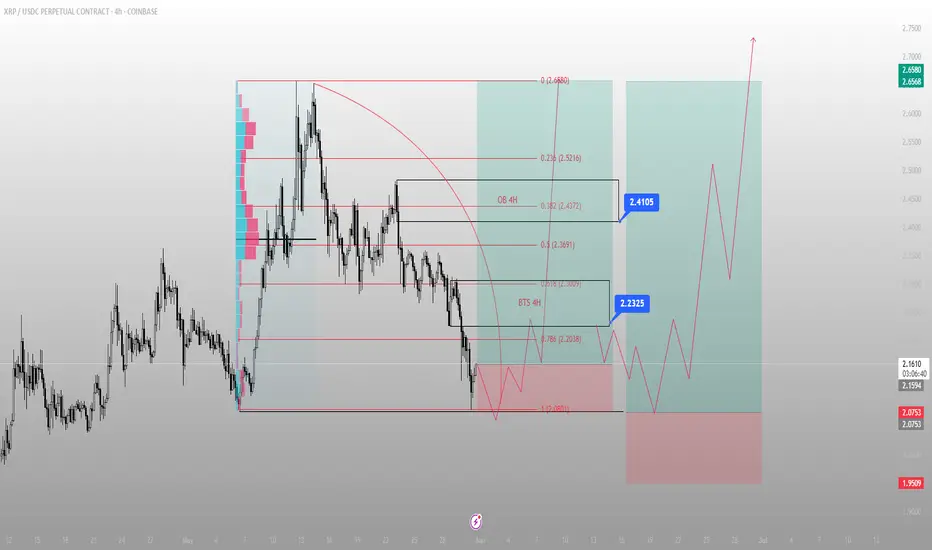
XRP didn’t break down. It just returned to origin.There was no crash. Just a clean delivery.
BINANCE:XRPUSDC swept the prior low and tapped directly into the 1.0 extension of the move — right at 2.0901 — closing below liquidity, only to reclaim it on the next candle. That’s not weakness. That’s Smart Money reloading.
Below that low sits the 4H BTS zone, overlapping the 0.618 and 0.786 retracements (2.2038–2.2325). That zone was engineered. Built. Not random. Price has already started responding.
The first draw is clear: 2.2325 — back into the inefficiency left behind on the breakdown. From there, we face a clean decision point at 2.4105. That’s where OB meets .382 retracement — and it’s a known trap zone for liquidity.
If price rips through it, 2.5216 becomes the magnet. If it rejects, I’ll be watching for a final mitigation before the full macro expansion.
Execution clarity:
✅ Entry: Inside BTS 4H zone (2.0901–2.2038)
🎯 Target 1: 2.2325
🎯 Target 2: 2.4105 (4H OB + liquidity pool)
🛑 Invalidation: Close below 1.9509
XRP TO 5 usd ? Just an idea for possibly Long on XRP
Whtite lines are my TP
Let me know what you think
Not a financial advise!

XRP/USDCThis chart represents a potential long trade setup for XRP/USDC on a 15-minute timeframe.
Break of Structure (BOS): A strong bullish move broke previous resistance.
Liquidity Grab ($$$): Price may sweep liquidity below the current range before pushing higher.
Order Block (5 min OB): The blue zone marks a demand area where buyers might step in.
Trade Plan: Expect a dip into the order block, followed by a bullish move towards the upper liquidity zone ($$$).

Wave 1 as leading diagonal (better chart pic)
I think it's worth bearing in mind that we could see some significant downside during the lull at the end of Q1. Red for Valantines, Green for St Patrick's.
This shows how we may never have transitioned into wave 2, but may actually be about to finish wave 1 as a leading diagonal.
We could be looking at wave 2 as a running/ expanding flat, in which case we see a significant rally, but something is niggling at me about this.
Watch the break of the high at $3.39, I'll be looking at the 4hr RSI to see if there's divergence. A close above with that divergence will possibly spell more downside than just a subwave correction.

Wave 1 as Leading DiagonalI think it’s worth bearing in mind that we could see some significant downside during the lull at the end of Q1. Red for Valantines, Green for St Patrick’s.
This shows how we may never have transitioned into wave 2, but may actually be about to finish wave 1 as a leading diagonal.
We could be looking at wave 2 as a running/expanding flat, in which case we see a significant rally, but something is niggling at me about this.
Watch the break of the high at $3.39, I’ll be looking at the 4hr RSI to see if there’s divergence. A close above with that divergence will possibly spell more downside than just a subwave correction.

Updated wave count shows wave D complete.So, I’ve updated my wave count to better align with what has happened, and discovered something I had missed in the process.
What I thought was wave E is probably better explained as a part of wave D, and the recent breakout was the final leg of wave D.
Wave D in a triangle often ends with a breakout attempt, and my anticipation in seeing it earlier but it not being there has now been resolved!
In redrawing it has become clear that wave D has been trading inside a rising wedge, which is now ripe for wave E to drop out of the bottom of it. I had missed this, but price is consolidating at the bottom of the wedge now.
Target for a rising wedge as a continuation pattern is the start of the lower boundary of the wedge, which puts it at $1.98.
However, wave E more often undershoots expectations, as opposed to overshoots them. So my target remains $2.15 - $2.05.
There is the observation of alternating wave characteristics, so if wave D is long and complex, wave E is likely to be short and simple.
The arrow pointing up at the end is what I expect, but that is based on hope. It could be an arrow down and I’d have just as many reasons to explain why it’s pointing down.
So, although the weekly looks as though it’s possibly targeting $1.90 as a weekly ABC, the actual structure of the correction remains a triangle and so wave E undershoot remains keen in my mind.
Just keeping it real, not doing any fudding or owt.

Wave E - Rangebound downtrend. $2-2.10Wave 2 correction has printed a symmetrical triangle, and has conformed quite tightly to it. I had been watching for this pattern from wave B top at $2.73, and wave C confirmed it. Wave d downtrend caught me slightly off guard, and wave d rally came slightly sooner then expected, but ultimately it’s what I have expected.
Wave e is likely to stay rangebound, with diminishing volume, and will probably make a fakeout attempts, but probably only small wicks. I am anticipating a final shake out/fakedown/liquidity hunt some time next week to the $2-2.10 range, but it might drop out of the bottom of the triangle if there’s enough liquidity, although I imagine buyers are going to be snapping it up before then,
I am thinking next week, but in reality it’s within two weeks, when a bunch of crypto bro’s who have been packing bags for 4 years get into the white house.
Wave 3 is liable to be pretty explosive, and wave 4 will be much shorter in duration than this wave 2 has been, as it will alternate and be either a zigzag or a flat correction, but it might be deeper.
I’ll be taking profits at $4.50, which is the 1.618 of wave 1, but I’m anticipating it running harder than that before wave 4.

"Warning: Turbulence Ahead for XRP""XRP is dangerously overbought, heavily influenced by dark pool manipulation and volume thresholds orchestrated by whales. These hidden forces have created a mismatch in volume, artificially driving XRP’s price higher and luring retail investors into the rally.
However, a significant divergence is on the horizon, signaling a potential sharp correction. While it’s uncertain how low prices may drop, my analysis suggests possible support levels at $1.90 and $1.64—but the fall could extend even further. This is a critical moment for traders to stay cautious and vigilant as market dynamics unfold."

XRP/USD analysis, possible buy areaBUY AREA AT 0.7860 for XRP/USD, feel free to share your opinion at comment sector or PM
LB

XRPUSD - 1W - Hidden Bullish DivergenceNot a financial advisor!
The new higher low is marginally higher
....
but still makes this Hidden Bullish Divergence valid!

XRP - UPSIDEXRP is still in a bullish cycle, on the 4th of December 2021 it completed the last of a 3 wave correction downside, I think the end of this correction means XRP can reach new highs, thought we were expecting to end the correction at about $0.84 areas with a maximum retracement going as low as $0.60, We were not looking to exceed below our blue box area thought at times it happens(not in this case) when markets are at extreme levels and due for major trend reversals.

XRP/USDC longPrice is trying to make the resistance support and we were are waiting for more information.It’s a buy if buyers confirm 1450 level…yellow line. If sellers confirm 1450 level than short. There’s a double top formation that is very sexy to a single bottom.

$XRPClearly $XRP has made a massive break ABOVE key down trending resistance, which it has now turned to support. If we are to identify the next resistance level, one has to look no further than the .618 FIb. $1.41 is the Key, break that and it would not shock me to see $XRP explode to $2 in short order.

XRPeeeeTeknikal Tipz:
#XRP
Possible na bumaba ang presyo sa $.64 bago tuluyang umakyat ng $.82.
Still shows bullish signs sa 1D Timeframe kahit overbought na dahil sa bullish divergence.

XRP is going hit $5 soon, BIG NEWS!!!dear traders,
the hearing from today bombshell:
a big exchange asked the SEC, can we trade XRP? is it a currency or a security? that was in 2019. The SEC didn't response, so the exchange traded XRP.
So what changed between 2019 and 2020: Nothing... Strong point from the lawyers of XRP. Big fault from SEC.
Things are very positive for XRP.
You saw that run from BNB, beware a XRP run which will be bigger.
Good Trading, Hans


Prepare for XRP breakout Even if XRP drops to 0.20 , we still need to prepare for a breakout . I can't wait to see XRP hit ATH :)

XRPUSDC Long Cup & Handle in a Cup & Handle ScenarioCould we be forming a small cup and handle to rise further into a larger cup and handle?

XRP Target 0.5Forming global inverse H&S on the daily chart. Price target = height of the figure, which brings us into the .50 area. Will see how this pans out.

XRP/USDC H&S break Pattern What is next? Hi to all, this is my idea on XRP,
Please comment if you agree or not with this idea.
XRP price just bounce with a little bit of trouble form the EMA200 and break the neck line from the previous H&S pattern, this means that the bearish market end.
The MACD and the RSI also are ready to support this movement.
Enter Price above the neck line: 0.23
Targets:
Right Shoulder: 0.241
Head: 0.255
Adro

Ripple Price Reversal Action Unstoppable Towards $0.22
Ripple extends bearish correction from $0.25 weekly high, targets $0.22.
Technicals could remain bearish throughout the American session on Thursday.
Cryptocurrencies across the board are sinking deeper into the rabbit hole. Altcoins like Ripple are erasing the gains accrued in the last one week. XRP, for example, is extending the bearish pressure from the recent high at $0.25 to levels slightly above the 61.8% Fib retracement level of the last swing of $0.2530 to a swing low at $0.1643.
The declines on the day have broken below the ascending channel support. The move appears to have increased the confidence the sellers have as well as their grip on the price. It is possible that the declines will test the support at $0.22.
On the flip side, movements to the north will remain capped under the broken channel as well as the key hurdle at $0.23. It is essential that the bulls reclaim the position within the channel and focus on breaking the resistance $0.24 and $0.25.
Technical analysis shows that the ongoing correction could last through the American trading session. The Relative Strength Index (RSI) doubles down on the bearish picture. As long as the RSI is not oversold, Ripple will continue to deal with the bearish pressure. In addition to that, the Elliot Wave Oscillator has started a new bearish session.
In the meantime, the 100 Moving Average will continue to offer short term support at $0.2335. If the support at $0.22 were to give in, XRP will bank on finding support at lower levels including $0.21 and the 23.6% Fibo.
Ripple Key Levels
Spot rate: $0.2235
Relative change: -0.0092
Percentage change: -4.3%
Trend: Bearish
Volatility: High
