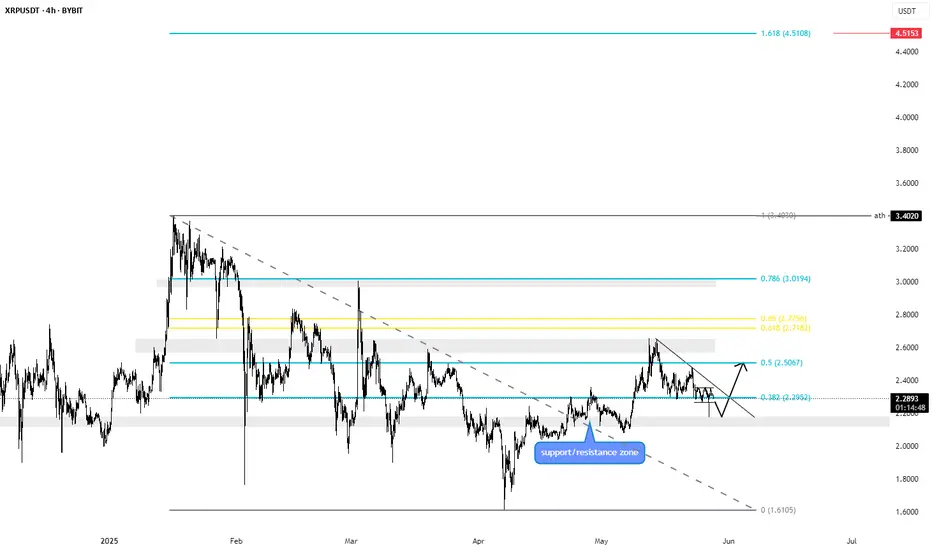
Is XRP ready for the big bang?This is an update of my analysis from last week; then I was bearish for xrp in the short term because we had to play out a triple top on the 4h. In the meantime, it has been played out nicely and we have fallen back into a strong support zone. As you can see, we are in a pattern of a pattern, namely a falling wedge, which in my view is the retest of the big bull flag. If I measure both, we will first go to the golden pocket, which is the target of the falling wedge where we will find some resistance, and then rise to the 1.618 fibonacci level, which is the target of the big bull flag. I will keep you informed. www.tradingview.com
XRPUSDT.3L trade ideas

HolderStat┆XRPUSDCRYPTOCAP:XRP price pulse: Ripple leaps from consolidation and now coils just under 2.48 resistance inside a falling wedge. TA signals breakout toward the ceiling, mirroring earlier triangle bursts, while layered support keeps the bullish scenario in play.

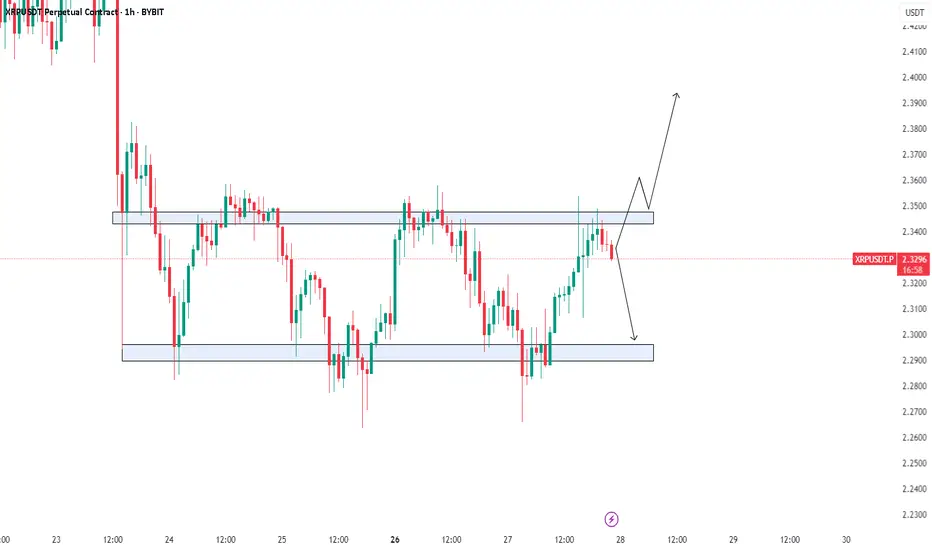
Lingrid | XRPUSDT false Break Below Daily LowsThe price perfectly fulfilled my previous idea . BINANCE:XRPUSDT has rebounded from the lower boundary of the descending channel, forming a potential double bottom near $2.26. Price action suggests building momentum within a consolidation zone, with targets aligned at the $2.34 level just below trendline resistance. A higher low could set up a clean push toward the upper channel range. Watch for breakout signs above the blue line.
📈 Key Levels
Buy zone: $2.26–$2.28
Buy trigger: confirmation above $2.29
Target: $2.34
Sell trigger: breakdown below $2.26
💡 Risks
Rejection at trendline near $2.30 may stall upside
Failure to hold above $2.26 support shifts bias bearish
Weak volume on rebound could signal short-term fakeout
Traders, if you liked this idea or if you have your own opinion about it, write in the comments. I will be glad 👩💻

Wycoff On the 1 Hour Time Frame Spring? XRP Looking for opinions here.
What do you think? Did we just hit the spring phase of this 1 hr set of moves? The 4 Hour might be more compelling.
Thoughts?

XRP 5X Lev. Full PREMIUM Trade-Numbers (PP: 1380%)Good afternoon my fellow Cryptocurrency trader, this is a great weekend and a wonderful day.
The bullish bias for XRP has been confirmed more than enough. It is time. The time is right and the time is ripe to go LONG.
I am publishing to give you full trade-numbers for you to enjoy.
This is a high probability chart setup.
I am wishing you success and great profits. Crypto is going up.
We are doing mid-leverage on this pair. We are going with 5X because the action is already moving. Earlier, we would go higher, but we like to keep risk moderate.
Full trade-numbers below:
_____
LONG XRPUSDT
Leverage: 5X
Current price: $2.15
Entry levels:
1) $2.18
2) $2.12
3) $2.05
4) $1.98
Targets:
1) $2.50
2) $3.02
3) $4.51
4) $6.29
5) $8.08
Stop-loss:
Close weekly below $1.95
Potential profits: 1380%
Capital allocation: 5%
_____
I am wishing you great profits and tons of success.
This is for advanced traders.
You decide how to secure profits, how to adapt to market conditions and how to trade.
You also decide your own level of risk. If you win, all the profits are yours.
If you lose, that's ok, the market offers endless opportunities and life goes on.
It is not about winning them all. It is about winning and growing.
Thanks a lot for your continued support.
Namaste.

XRP 5X Lev. Full PREMIUM Trade-Numbers —New Entry (PP: 815%)When the market is over-leveraged, when there are too many people out of control, you can feel a kind of tension; anxiety in the air... Sure enough, the market starts to shake and all these over-leveraged hands are removed. Once removed, the market becomes calm... Can you feel the calm? It is as if the gamblers are now gone.
Good morning my fellow Cryptocurrency trader, we have many charts, my leveraged trades, all green. We have second entries for BTC, ETH and ADA but none for XRP.
So, if you missed the first one, here is another one... It is risky, but the show must go on.
We are set to experience a very strong wave of growth. Getting in before the breakout can be live changing, just keep in mind that nothing is certain, leveraged trading is high risk. High risk vs a high potential for reward.
The signals here are not strong, but I believe we have very good timing, and if the timing is good, the price must also be.
_____
LONG XRPUSDT
Leverage: 5X
Entry levels:
1) $2.45
2) $2.35
3) $2.30
4) $2.26
5) $2.07
Targets:
1) $3.05
2) $3.40
3) $3.82
4) $4.08
5) $4.50
6) $5.18
7) $5.67
8) $6.29
Stop-loss:
Close weekly below $2.05
Potential profits: 815%
Capital allocation: 3%
_____
When the market calms down, it means that no more gamblers are around. When no more gamblers are around, the growth process can continue.
This is an unconventional signal, but you can't deny the change. One day, everybody is going wild, the next day, only the usual suspects remain.
When the market grows and moves to resistance, everybody wants to go LONG. When prices are low, people tend to detach and ignore. It is the other way around, sell at resistance and buy at support.
Time to go LONG.
Namaste.

That on ramp was closedWell, as you can see XRP took the southbound ramp.
There was a head and shoulders forming on the 30m this morning.
The trend is your friend is true. Look for opportunities and allow the trade to come to you, don’t force them.
Same chart, same lines
I am bullish on XRP and see anything lower still as healthy. It’s compressing IMO for a spring. However, I enjoy trading and 🥩 so I scalp and swing shorts & longs.
Don’t get locked into a one or the other mindset. Do some TA and stick to your strategy. The payoff is worth it.

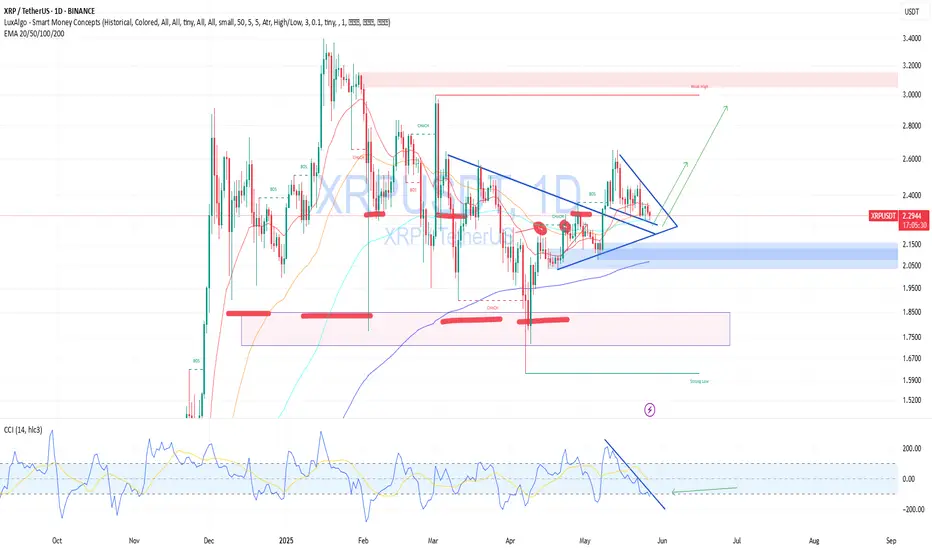
Swing Trade OpportunityHello traders,
XRP is forming a potential falling wedge with strong upside potential. Price action has printed a middle section and is now consolidating at a high-value area. Despite the picture-perfect setup, the entry remains high-risk, as the consolidation could act as a continuation. However, XRP has been lagging recently, and positioning looks ideal for an upside move. The HTF structure shows a strong impulse followed by a correction; this could be the level where the next leg up begins.
I can afford to take the risk on this one. Wish y'all the best!

Liquidity Pools Becoming Dark OceansThe foreign exchange market and the cryptocurrency market differ fundamentally in liquidity, participant makeup, and incentive structures. The FX market is characterized by deep liquidity and a broad spectrum of institutional participants, which together support global financial stability. By contrast, the cryptocurrency market—especially for new tokens and meme coins—is driven largely by profit-seeking agents without built-in mechanisms to ensure orderly trading. This disparity raises the prospect that, as crypto liquidity pools expand, opportunistic actors may exploit them in ways that threaten both crypto markets and the wider economy.
The FX market is the largest financial market in the world, with average daily turnover of US \$7.5 trillion in April 2022—a 14 percent increase from three years earlier . This volume is supported by major banks, central banks, hedge funds, multinational corporations, and retail investors. In contrast, the cryptocurrency market’s average daily trading volume in Q1 2025 was US \$146 billion, and spot volume stood at about US \$51 billion per day . The much shallower depth in many crypto tokens makes them more vulnerable to price swings and manipulation by large orders or coordinated schemes.
Major FX market makers such as JPMorgan, UBS, and Deutsche Bank operate under rigorous risk-management frameworks that promote orderly trading. Central banks and corporate hedgers further contribute to stability by smoothing excessive volatility and hedging currency exposures . These participants balance profit objectives with responsibilities toward market integrity. In crypto markets, however, large holders or “whales” typically focus on maximizing returns. Without formal obligations to provide liquidity, their trades can trigger extreme price movements, especially in tokens with limited float.
Meme coins highlight these dynamics vividly. They often attract speculative investors through hype, driving rapid price rallies. Once insiders or developers decide to exit, they can execute “rug pulls,” dumping their holdings and crashing the token’s value. Chainalysis data shows that ERC-20 tokens involved in pump-and-dump schemes yielded average profits of about US \$2,672 per dump . In July 2023, an exploit on the Multichain bridge—akin to an insider-driven rug pull—resulted in over US \$125 million drained from DeFi liquidity pools .
As crypto liquidity pools grow, they risk becoming “dark oceans” where opacity and profit-driven agents dominate. Unlike the FX market—where large trades prompt interbank controls and regulatory checks—crypto markets often lack coordinated circuit breakers. Malicious actors can engage in wash trading, spoofing, and layering with little fear of immediate enforcement, amplifying volatility and undermining confidence.
If corporations and financial institutions increase their crypto exposure without adequate safeguards, these vulnerabilities could spill into the broader economy. Market instability might trigger margin calls, liquidity shortages, and balance-sheet disruptions. State or non-state actors could exploit crypto’s pseudonymous nature to influence currency flows, evade sanctions, or engineer financial shocks with real-world consequences.

$XRP is forming an inverse cup and handle pattern CRYPTOCAP:XRP is forming an inverse cup and handle pattern 👀
Price is hovering around a critical support level — a breakdown here could get ugly. ⚠️

XRP Ready for PUMP or what ?Ripple has successfully broken out of the falling wedge pattern and retested the breakout zone,the price is holding firmly above previous resistance, which now acts as strong support.
Continued strength could lead to upward movement toward targets at $2.65, $2.95, and $3.35
Stay Awesome , CobraVanguard

Whales Wrote the Rules stop your imagination and Lose more Is it true that whales control the charts, or is it just another trading myth?
Why does everything look perfect—until the exact opposite happens?
This analysis reveals how smart money traps retail traders in plain sight.
Hello✌
Spend 3 minutes ⏰ reading this educational material.
🎯 Analytical Insight on XRP:
XRP is showing classic signs of compression, resembling a tightly wound spring ready to release. Momentum is building, and a breakout appears imminent based on current price structure and volume behavior 📈. While my long-term outlook remains significantly bullish, this setup suggests a conservative upside of at least 18%, with a key target in focus at $2.70 🚀.
Now , let's dive into the educational section,
📊 TradingView Tools to Track Whale Behavior
One of the most powerful truths in trading is this:
Smart money always leaves a trace—you just need to know where and how to look. TradingView provides some powerful tools to help you identify those footprints.
Volume Profile (Fixed Range / Session Volume): Use this tool to spot where the most volume was traded in specific ranges. These high-volume areas often signal zones where whales have entered or exited positions.
Smart Money Concepts / Order Blocks : Now natively available in TradingView for Pro+ and Premium plans, these highlight potential manipulation zones, institutional footprints, and key support/resistance levels.
Liquidity Zones: Use custom indicators like Liquidity Pools Detector or combine ATR with price structure to visualize high-risk/high-reward zones—whales love ambushing retail here.
Practical Tip:
Open the Bitcoin chart. Apply the Volume Profile Fixed Range tool across a two-week range. Look for areas with the highest volume concentration—these are likely whale action zones. Now overlay the Order Block indicator. You’ll often find those zones overlap.
🧠 Understanding Whale Behavior
Whales typically act when the crowd is at extreme fear or greed.
They move against the market’s emotional wave—and to do that, they need to mislead the herd. They create setups that look obvious but are designed to trap.
🐟 How Retail Traders Get Hunted
Here’s the classic trap:
The market makes a fake drop → panic selling → retail goes short.
Then whales step in, absorb liquidity, push price up → retail goes long too late.
Finally, whales dump at the top, and price collapses again.
🔄 Whale Playbook: The Four Phases
Silent Accumulation
Fake Breakout Pump
Distribution During Peak Greed
Dump + Liquidity Grab
You’ll find this playbook hidden in plain sight—if you stop chasing noise and start tracking volume, liquidity, and sentiment.
⚠️ Why Retail Always Ends Up on the Wrong Side
Because they’re looking for confirmation, not truth.
Whales exploit this—chart patterns, indicators, and fake breakouts are all part of the trap.
You need more than candles—you need context.
🔍 Chart Patterns or Psychological Traps?
Patterns like Head & Shoulders, Wyckoff Phases, or Triangles?
Whales know you’re watching them. They use these patterns as bait.
Unless combined with volume confirmation and liquidity context, most patterns are psychological illusions.
🧭 How to Follow the Smart Money
Study candle behavior with volume (Volume Spread Analysis)
Drop to lower timeframes to confirm liquidity zones
Use Anchored VWAP from major pivot highs/lows
Watch for divergence between price and volume—especially at highs/lows
💡 Conclusion:
There’s no holy grail in trading—but if you start thinking like a whale instead of chasing them, you’ll stop being the bait.
Use TradingView’s institutional-level tools to decode real market intentions.
Next time you spot a "perfect breakout," ask: who's on the other side of this trade—and why?
always conduct your own research before making investment decisions. That being said, please take note of the disclaimer section at the bottom of each post for further details 📜✅.
Give me some energy !!
✨We invest countless hours researching opportunities and crafting valuable ideas. Your support means the world to us! If you have any questions, feel free to drop them in the comment box.
Cheers, Mad Whale. 🐋

Short term bearisch on XRPXRP shows a triple top on the 4h chart which is a strong bearish pattern. If we are going to play this, this nicely matches the testing of a previous resistance/support zone. which we are now going to test again. If we manage to convert it into support and we break the trendline, the way is clear to the 1.618 fibbonachi level, which amounts to a value of approximately 4.5 usdt. www.tradingview.com www.tradingview.com
XRP/USDTPrice made 2 bounces from the elite zone already and is showing same sign the 3. time now...but we have to be carefull since we are in a range and there is no signs of new lows nor highs but it is true that we are in a slow sell trend overall and crypto short fall...let see what we can play out of this!
Ripple buy signalHello friends
Given the good growth we had, we entered a deep correction, and now we have the opportunity to buy step by step in the specified support areas with capital and risk management and move with it to the specified targets.
*Trade safely with us*

HolderStat┆XRPUSD rebound Ripple—path to sell-zoneCRYPTOCAP:XRP — Sharp rebound tagged 2.65 and carved a rising wedge riding a firm 2.40 k trendline. Current coil suggests a bullish continuation toward 2.90-3.00 k supply zone; failure to hold 2.30-2.35 k only delays, not kills, the broader uptrend. Liquidity build hints accumulation.

Ripple Potential UpsidesHey Traders, in today's trading session we are monitoring XRP/USDT for a buying opportunity around 2.23 zone, Ripple is trading in an uptrend and currently is in a correction phase in which it is approaching the trend at 2.23 support and resistance area.
Trade safe, Joe.

XRP $4.5 Followed by $6.29 Target ConfirmedThere is a small support zone around $2.30 that has been tested and retested since 17-May, it holds and it is now confirmed. You can truly hit the gas now, go all-in on XRP. I say this because the next advance (higher high) is about to get started in the coming hours and days. The full advance of course can take weeks or months to develop but the low entry prices and the buy-zone can be available only for a few more hours, maximum a day or two, before it is gone. I don't believe it will last days but we are still here today.
If the bears had the strength to move the market lower they had 10 days to do so, they failed. A bearish failure is a bullish success.
This is just a friendly reminder because I know you love XRP and I am happy to give you post/charts with great entry price and timing. A high probability of success.
There is no doubt in mind, 100% certain. XRPUSDT is set to grow next.
Thank you for reading.
If you agree follow & boost.
If you agree strongly leave a comment, just a few seconds of your time and it makes a difference. Share, how long have you been holding for? Did you manage to join the previous wave in late 2024? What about the buy zone in early April?
It is never too late, the market always gives a second chance.
This is the third one. The time is right and the time is ripe.
Prepare for financial success. Profits.
Namaste.

Xrp Short Term PossibilitiesBINANCE:XRPUSDT.P
I am sharing this analysis for myself, it is not investment advice.
İn xrp we see a major bearish channel, in the channel we are nearly on the top. And Then wee see a triangle formation short term price move.
İf we break the triangle up we go double resistance area, normal resistance and channel line. İf we go down we are probably see a reaction on the white line and go up, after we go up if 2.27 resistance hold us we go to 2 dollar zone, but if 2.27 dont hold us we go to channel upper limit again.
Lastly, the cumulative delta is showing us a not good sign too. I used perpatual for this analysis but on the spot side things are not different too.

XRPUSDT 4H | Untested Demand Zone RevisitIn this 4-hour chart analysis of XRPUSDT, I’m focusing on a clear and well-defined untested demand zone between 2.05–2.13 USDT . Unlike the first demand zone (already tested and played out), this second zone has not been retested since its formation, making it a fresh area of interest for a potential long setup.
Why this matters :
Untested demand zones often act as powerful magnets for price when revisited, as they represent areas where large buy orders might be waiting to be filled. Because this zone has not been revisited yet, there’s a higher probability for a bullish reaction when price returns to it.
Key Technical Factors :
✅ The 2.05–2.13 demand zone was formed following a significant bullish impulse that created a clear break of structure to the upside.
✅ Price is currently consolidating above this demand zone and also above a potential bearish CHoCH at 2.0784 . This suggests that the bullish structure is still valid unless price breaks below 2.0784.
✅ My bullish target is 2.65 USDT , where previous highs were formed and potential liquidity exists.
✅ My stop loss is set just below the demand zone, around 2.05 , to protect against a deeper retracement or a shift in market structure.
My Thought Process :
I expect that if price returns to the demand zone, there will be a strong chance for buyers to step in and push the market higher. However, I’m aware that if price breaks below 2.0784 , it would signal a bearish CHoCH and invalidate the long scenario. Therefore, patience is key — I’ll wait for price to either test the zone and react strongly or stay above 2.0784 to keep the bullish bias intact.
Clear Trade Setup :
📌 Entry Zone : 2.05–2.13
🛑 Stop Loss : Below 2.05
🎯 Take Profit : 2.65
🧩 Invalidation : Break below 2.0784
💬 Let me know if you have a similar zone marked out or if you see a different setup! Let’s share ideas and refine our strategies together.

XRPUSDT — Buy From Support, Waiting for Triangle BreakoutOn the 4H chart, XRP is consolidating inside a symmetrical triangle and holding above an ascending trendline — a key support zone that has held multiple times.
🧠 Fundamentally:
Ripple continues expanding partnerships with fintech and banks.
The SEC lawsuit has lost its grip on price action.
A potential Fed rate cut could push crypto sentiment up again.
📌 I’m entering positions near $2.31, gradually accumulating. A breakout above the triangle could trigger a strong move.
🎯 Targets:
$2.50 — initial resistance
$2.65+ — if breakout is confirmed with strong momentum
🔽 If price breaks below $2.20, I’m looking to buy confidently near $1.80, where major demand sits. I don't expect such a dip, but markets can surprise.
XRP is looking for a way outXRP has broken the April trend line, it has also found support temporarily.
I am watching as it has avoided a couple downward channels over this past weekend. Currently it is attempting to find a ride towards 2.35
If this channel doesn’t work for it we may see it ride the yellowish channel down towards 2.20
Btc conference this week. EU tariffs delayed. Macro event is what may be the catalyst to either side.
I am overall bullish and still DCAing.
Good luck this week

XRP Eyes Breakout Toward $2.92 – Channel Structure Holds
CRYPTOCAP:XRP is currently trading inside a rising channel and holding the midline support around the 0.618 Fibonacci level. This zone has acted as a launchpad in the past and could again support a strong upward move.
✅ Structure: Bullish channel
🧠 Key Support: ~$2.18–$2.22 (aligned with 0.618–0.786 Fib levels)
📍 Trigger: Bullish continuation from this zone confirms trend resumption.
🎯 Target: $2.9206
This is the projected move based on the height of the channel structure.
Watch for volume confirmation on the bounce — the setup remains valid as long as XRP stays above key support.
