DeGRAM | XRPUSD out of the triangle📊 Technical Analysis
● XRP has retested the long-term purple trend-line it broke in May and bounced at the $2.05–2.15 support, locking in a higher-low on the new rising base.
● Price is coiling inside an ascending triangle capped by $2.44; the pattern’s 1 : 1 swing and the channel roof intersect at $2.81. RSI stays above 50, showing buyers still control momentum.
💡 Fundamental Analysis
● In the remedies brief the SEC trimmed its disgorgement request, and the judge set a July settlement check-in, reducing tail-risk.
● Santiment notes whale wallets (>10 M XRP) accumulated ~60 M XRP since 14 Jun, hinting at renewed institutional demand.
✨ Summary
Buy $2.10–2.20; sustained break above $2.44 targets $2.60 then $2.81. Invalidate on a 16 h close below $1.98.
-------------------
Share your opinion in the comments and support the idea with a like. Thanks for your support!
XRPUSDT.P trade ideas

#XRP/USDT#XRP
The price is moving within a descending channel on the 1-hour frame, adhering well to it, and is heading towards a strong breakout and retest.
We are experiencing a rebound from the lower boundary of the descending channel, which is support at 2.21.
We are experiencing a downtrend on the RSI indicator that is about to be broken and retested, supporting the upward trend.
We are heading for stability above the 100 Moving Average.
Entry price: 2.24
First target: 2.27
Second target: 2.30
Third target: 2.35

XRP: You Have What it Takes, Success is Yours!It seems XRP has been trading at the same price for more than 7 months. The mean price since XRP broke above $2 back in December 2024.
Can you see what I am referring to? Good if you do.
If you don't, continue reading, everything will be clear in a few seconds.
Price action
Is neutral price action at this point bearish or bullish?
Bullish.
Most of the action has been happening above $2 and this is clearly bullish.
The upswings are bigger than the down-swings.
Buy volume is higher than sell volume.
The main move is an advance that started in November 2024.
The bigger picture and major trend is bullish.
The fundamentals are getting better everyday; there is nothing bearish on this chart.
Where to next?
New all-time high and higher prices.
How to approach the market
Start with 3-5X. When the bullish action is fully confirmed, the market starts to move higher supported by high volume and marketwide wide action, go all-in. That's the only way to win.
Make the winners pay big. Keep the losers small.
If you don't take risk you can't win in this or any other game.
Thanks a lot for your continued support.
Trading tips
Only risk money you can afford to lose and make sure to do a calculated risk. Not crazy risk nor gamblers risk. 2-3X. As the market advances, 3-5X. When the trend is confirmed, go higher and continue to increase until you max everything out. When our target hits sell everything and never look back. You can buy again when there is a crash or a retrace. Opportunities are endless.
If you secure profits and the pair continues to grow; who cares! Buy one that is safe and secure. Buy a new one that is trading low. Don't go back to the same pair just because you won. Detach. Take some time out. Secure profits. Comeback refreshed and the market will bless you with endless opportunities, it is not going away.
Motivation
Just make sure to win-win-win.
If you can win small, you will eventually win big.
Win, win, win. Make a habit of winning.
Go step by step.
Many people overestimate what they can do in a year but underestimate what they can achieve in a decade. Think long-term.
Instead of tomorrow, next week or next month, think how much money you are going to make in a decade if you start preparing now. What if everything you are doing does not need to yield an instant result? Now you can relax your mind. It will all come to you, but let it come, there is no rush.
Even if you hurry, life will continue to give you what you need, what you earned and not what you think is best. Whatever situation you are in right now is the result of past action. Take responsibility and watch everything grow.
Your future can change if you make the right choices today. You can change everything, start now; what can I do today to make my day better? What is the best action to take? Should I go out and get drunk, sniff a bunch of drugs, or, should I exercise and eat clean, do what it takes to reach my goals?
Choose wisely and watch your profits grow.
Whatever results you get when trading is just a reflection of your mind and the choices you make in your day to day live. Belief and take control.
You have what it takes.
Success is yours.
Namaste.

XRP - Straight HorseSight!XRP Vision is quiet clear - The two areas are areas of hold and from this side straight up move can be seen, though slow death move can be seen on the line marked, but its mostly due to liquidity sweeps!

XRP - Trade The Range!Hello TradingView Family / Fellow Traders. This is Richard, also known as theSignalyst.
📈XRP has been trading within a range between $2 and $2.35 in the shape of a flat rising broadening wedge pattern in red.
🏹 The highlighted blue circle is a strong area to look for buy setups as it is the intersection of the green support and lower red trendline acting as a non-horizontal support.
📚 As per my trading style:
As #XRP approaches the blue circle zone, I will be looking for bullish reversal setups (like a double bottom pattern, trendline break , and so on...)
📚 Always follow your trading plan regarding entry, risk management, and trade management.
Good luck!
All Strategies Are Good; If Managed Properly!
~Rich

HolderStat┆XRPUSD reboundBYBIT:XRPUSDT is carving higher lows off 2.03 support through a wedge break, morphing base into bullish momentum. Holding the rising line sustains upside tilt; clearing 2.35 unlocks 2.55 and breakout buzz 🌊

Weekly trading plan for XRP BINANCE:XRPUSDT Price has reached the weekly pivot point, so now it is important to understand the further reaction. Several trend lines can be seen on the chart. If the lower trend line and the level of 2.18 are broken, the price will probably continue its downward movement to the support zone, but it will already renew the local bottom.
Write a comment with your coins & hit the like button and I will make an analysis for you
The author's opinion may differ from yours,
Consider your risks.
Wish you successful trades ! mura

XRPUSDT UPDATEPattern: Falling Wedge
Current Price: $2.2130
Target Price: $4.00
Target % Gain: 70.09%
Technical Analysis: XRP is forming a falling wedge on the 1D chart. Price is approaching the resistance trendline with potential for breakout. Volume looks stable; a breakout above $2.40 may trigger bullish momentum.
Time Frame: 1D

About the chart that shows a sideways movement...
Hello, traders.
If you "follow", you can always get new information quickly.
Have a nice day today.
-------------------------------------
When you study charts, you will realize how difficult it is to move sideways.
Therefore, depending on how long the sideways movement was before the big wave, the size of the wave is also predicted.
However, in the charts showing sideways movement, the price range and wave size are often known after the wave appears.
This shows that the location of the sideways movement and the size of the sideways wave are important.
-
Looking at the chart above, we can say that it is showing a sideways movement.
However, since the price is located at the lowest price range, it is better to exclude this chart.
The reason is that if it is showing a sideways movement at the lowest price range, it is likely that the trading volume has decreased significantly due to being excluded from the market.
This is because it is likely to take a long time to turn into an upward trend in this state.
-
Looking at the chart above, the price is showing a sideways movement while maintaining a certain interval after rising.
The sideways movement is about 31%, so it may be ambiguous to say that it is actually sideways.
However, if the price moves sideways while maintaining a certain interval after rising, it means that someone is trying to maintain the price.
Therefore, when it shows a movement that breaks through the sideways section, it should be considered that there is a possibility that a large wave will occur.
The wave can be either upward or downward.
Therefore, it is necessary to be careful not to jump into a purchase with the idea that it will definitely rise in the future just because it moves sideways.
A box section is set at both ends of the sideways section.
Therefore, it is recommended to proceed with a purchase in installments when it shows support after entering this box section.
In other words, it is important to check the support in the 1.5-1.9669 section or the 25641-2.6013 section.
You can see that the HA-Low indicator and the HA-High indicator are converging.
Therefore, if this convergence is broken, it is expected that a trend will be formed.
-
Like this, you should measure the price position of the sideways movement and the width of the sideways movement well and think in advance about whether to proceed with the transaction when it deviates from that range.
Otherwise, if you start trading after the wave has already started, you may end up giving up the transaction because you cannot overcome the wave.
Since it is not known when the movement will start once the sideways movement starts, individual investors easily get tired.
Therefore, when the coin (token) you want to trade shows a sideways movement, it is recommended to increase the number of coins (tokens) corresponding to the profit while conducting short-term trading (day trading).
If you do this, you will naturally be able to see how the sideways waves change, and you will be able to hold out until a big wave starts.
I think there are quite a few people who are not familiar with day trading and say they will buy at once when the wave starts.
If you can hold out well against the wave, you will get good results, but there is a possibility that the trade will fail 7-8 times out of 10, so if possible, it is good to get used to the feeling by day trading coins (tokens) that show this sideways pattern.
-
Thank you for reading to the end.
I hope you have a successful trade.
--------------------------------------------------

The FATE of XRP will soon be DECIDED🔥 Hello everyone! I haven't reviewed XRP because it's not the best token for trading. It's purely an institutional token.
But it's painting a very interesting picture. Let's take a closer look:
📊 XRP is trading in a key area of interest and is therefore currently sandwiched between two powerful levels: support at 2.08 and resistance at 2.31. In addition, the price has just broken out of a downward channel and needs time to consolidate above it.
During the last impulse, two gaps formed below: 2.14 - 2.07 and 2.25 - 2.16. And as we know, in 99% of cases, gaps close sooner or later.
XRP is now literally at a crossroads and needs a bullish catalyst to move higher. Because it doesn't need a catalyst to move lower.
⚙️ Metrics and indicators:
Volume - there is a slight divergence between sales volumes and price. But it is practically flat, which means that seller pressure is still high.
Money Flow - in strict harmony with the price. Money leaves during corrections and enters during growth. The asset is completely flat, awaiting news or activity in the market.
📌 Conclusion:
XRP currently looks as unattractive as possible for trades, which means it's the best time! The next direction of price movement will soon become clear, and it will be possible to open positions.
Personally, I am inclined to believe that in the short term, we will go lower, along with the entire market. We will fill the GAP's lower, we may test $2, and then we will go higher.
Also, don't forget that the deadline for XRP ETF applications expires in the summer. And the adoption of the ETF could be just the catalyst we need. And considering that this is an institutional asset:
➡️ as soon as inside information about adoption or non-adoption appears, it will be visible on the chart when all institutional insiders start taking positio ns.
➡️ XRP may see good liquidity inflows right away. No one is holding it as a semi-ETF, as was the case with Ethereum. No one will sell it.
So for now, I'm just sitting back and watching what happens.
Have a great week, everyone!

XRP It will grow soon...The XRP chart shows a Triangle pattern, approaching a resistance level at 109k. A breakout above this level could confirm the next bullish target, but watch out for a potential reversal!
Best regards CobraVanguard.💚

XRP BREAKING OUT!!!Looking at XRP I see price breaking out of the daily downtrend with a invert head and shoulders pattern. In my experience these patterns have strong impulses in crypto trading and I expect BTC ETH and XRP all to move up from these levels as we are already seeing breakouts to upside on lower timeframes too.
16.June (today) is also big for XRP and SEC case, so potential news regarding the case could attribute to XRP breakout and strong moves up.
Immediate resistance level at 2.60. IF broken, price would then go towards the 3 dollar mark. Must look out for potential profit taking in these levels and in current political sphere should not expect any explosive moves right away.

They called it consolidation. I called it accumulation.Price was coiled in a defined OB + FVG combo — building pressure while the rest of the market slept. The moment we swept the low into the Order Block, the trade became personal. This wasn’t noise — it was alignment.
Why I entered:
Daily FVG + OB overlap — textbook Smart Money entry zone
Volume spike at the OB low, signaling smart accumulation
Structural BOS confirmation on intraday after sweep
What followed was an impulsive push through inefficiencies, climbing level by level toward pre-defined liquidity pools.
Targets:
TP1: 2.6464 — rebalancing zone
TP2: 3.00 — clean inefficiency top
TP3: 3.39 — liquidity magnet
Trade thesis:
Entry was set between 2.05–2.10, stop placed with precision below the OB. No guessing. Just calculated structure + narrative.
I don’t chase moves. I let price come to my zone. And when it does, I strike with full conviction.
Final words:
“Your edge doesn’t scream. It sits quietly in imbalance — waiting.”

XRP/USDT Daily-Timeframe (DTF) Technical & Fundamental AnalysisXRP/USDT Daily-Timeframe (DTF) Technical & Fundamental Analysis
On June 12, Ripple and the SEC jointly petitioned Judge Torres to vacate the injunction on institutional XRP sales and reduce penalties. Legal analyst John Deaton estimates a 70% chance that the outcome will favor Ripple, which could unlock momentum toward the $3.55 high.
On Technical side XRP/USDT is consolidating within a descending triangle pattern, reflecting both indecision and potential breakout pressure. The price is currently ranging between 2.0800–2.3300, with several minor key levels recently invalidated , indicating liquidity grabs and a developing Accumulation-Manipulation phase common in smart money behavior.
We’ve identified a potential buy-side opportunity if the price breaks and closes above 2.2700, a key minor resistance level. The trendline has been respected with three confirmed touches, but price remains just outside it, suggesting that a breakout above the triangle and the 2.2700 zone could trigger a strong impulsive move toward the upside.
📊 Trade Setup
📍 Area of Interest (AOI): 2.2720 (Buy on DTF candle close above)
🛡 Stop-Loss: 2.0900 (Below the liquidity zone)
🎯 Take Profit: 2.8320 (Next minor resistance / ~1:3 RR)
This setup is supported by institutional accumulation behavior, with manipulation and invalidated key levels paving the way for a potential breakout and rally.
Fundamental Outlook
ISO 20022 Compliance Boost
Ripple’s Interledger Protocol (ILP) recently gained formal approval for ISO 20022, the global standard for financial messaging adopted by banks and SWIFT. This enhances RippleNet and XRP’s integration into the traditional financial system.
SWIFT Endorsement
SWIFT has officially endorsed ISO 20022-compatible digital assets, directly benefiting XRP and increasing its potential utility across cross-border payment systems.
ETF Momentum
According to Polymarket, there’s an 83% probability that a WisdomTree XRP spot ETF will be approved this year — a major step toward institutional exposure and credibility.
Geopolitical Recognition
In a surprising move, former President Trump included XRP among five digital assets proposed to be part of a U.S. “crypto reserve”, signaling growing mainstream and governmental recognition.
📌 Disclaimer:
This is not financial advice. Always wait for proper confirmation before executing trades. Manage risk wisely and trade what you see—not what you feel.

The OB is set. The move just hasn’t been claimed yetThis is structure, not speculation. XRP tapped the 1H Order Block, held its low, and began building compression. Price is coiling — not failing. That matters.
The logic:
After the initial drop, price swept local lows into an untouched OB, then printed higher lows into a tighter range. That’s not weakness — that’s staging. Smart Money builds quietly. This is the echo of their positioning.
Above us sits a single, untested draw:
TP: 2.2540 — inefficiency fill, paired with external liquidity resting above last week's mid-range
Expecting one more dip into the OB is not only possible — it’s ideal. That’s where they’ll trap the impatient.
Execution:
Entry: 2.11–2.13 retest (into OB)
SL: Below 2.08
TP: 2.2540
No noise. No chasing. This is a campaign move — the kind that rewards precision, not emotion.
Final thought:
“I don’t trade the bounce. I trade the buildup before it’s even visible.”

XRp/USDTFor Ripple, according to the chart, we are in a wide trading range, and according to the lines I drew, I am waiting for a reaction to them. I have a rule: if I don't understand a part of the chart, I won't enter. Tell me your opinion, be sure.

XRP's Ending Diagonal: Climactic Push Towards $3.5-$3.8?XRP: Ending Diagonal & Final Push ($3.5-$3.8 Target)
Hello TradingView,
My analysis suggests XRP is in its 5th Elliott Wave, unfolding as an Ending Diagonal. This pattern signals a climactic end to the current bullish cycle, often followed by a sharp reversal.
Key Levels:
Target: $3.50 - $3.80 (marked on chart). This aligns with the diagonal's upper trendline and Fibonacci extensions.
Invalidation: $1.5986 (marked in red). A decisive close below this level invalidates the diagonal structure.
Catalysts: Positive SEC lawsuit developments and Spot XRP ETF speculation provide fundamental tailwinds for this final push.
Outlook: Expect a significant correction after this diagonal completes near its target. Monitor $1.5986 closely.
Not financial advice. Trade wisely.
#XRP #Ripple #ElliottWave #EndingDiagonal #Crypto #TechnicalAnalysis #PriceTarget #Invalidation #Reversal #SEC #ETF #Blockchain #MarketAnalysis #Bullish #Altcoin #TradingStrategy

XRPXRP Fundamentals and key buy zone like the 0.9329,1.4248 and 1.708 zone will be watched
1. Regulatory Clarity and Legal Resolution
SEC Lawsuit Resolved: In May 2025, Ripple (the company behind XRP) reached a settlement with the U.S. SEC, reducing its fine and confirming that XRP is not a security for retail investors in the U.S. This has removed a major barrier for institutional adoption and market participation.
Crypto-Friendly Environment: The appointment of a pro-crypto SEC chairman and a more favorable regulatory climate under the current U.S. administration have further boosted confidence in XRP’s legal status and prospects.
2. Institutional and Product Developments
Spot ETF Speculation: There is strong market anticipation for an XRP spot ETF, with major asset managers (like BlackRock and Franklin Templeton) having filed applications. Analysts estimate a high probability of approval by the end of 2025, which could drive significant institutional inflows, similar to what was seen with Bitcoin and Ethereum ETFs.
RippleNet and XRPL Upgrades: Ripple is expanding its network and upgrading the XRP Ledger (XRPL) to support institutional use, including:
Ethereum compatibility (EVM sidechain)
On-chain lending and tokenization of real-world assets
Enhanced compliance and identity features for banks and regulated institutions
Liquidity pools and advanced asset recovery tools
These upgrades are designed to make XRPL a go-to platform for banks and large enterprises.
3. Use Case and Adoption
Cross-Border Payments: XRP is designed for fast, low-cost, and scalable cross-border transactions, positioning it as a competitor to traditional systems like SWIFT.
Partnerships: Ripple has established partnerships with hundreds of financial institutions globally, and is actively targeting the $7.5 trillion daily remittance market.
4. Technical Strength and Market Sentiment
Bullish Technicals: XRP has broken out of bearish patterns and is trading above key technical levels, with strong support from high trading volumes and institutional interest.
Price Predictions: Analyst forecasts for 2025 range from $2.85 (short-term) to $5.50 (year-end), with stretch targets as high as $10–$20 by 2030 if adoption accelerates and an ETF is approved.
5. Risks and Challenges
Market Volatility: XRP, like all cryptocurrencies, remains subject to high volatility and speculative trading.
Overbought Conditions: Technical indicators suggest potential for short-term pullbacks if the market becomes overheated.
Regulatory Delays: While the legal outlook has improved, any delays or rejections of ETF applications could trigger corrections.
Summary Table: XRP Fundamentals (2025)
Legal/Regulatory SEC lawsuit resolved; XRP not a security for retail; pro-crypto policy shift
Institutional Demand High, driven by ETF speculation and RippleNet upgrades
Technology Fast, low-cost, scalable; EVM compatibility; on-chain lending; tokenization
Adoption Growing, strong focus on cross-border payments and financial partnerships
Price Forecasts $2.85–$5.50 (2025), $10–$20 (2030, if adoption/ETF succeed)
Risks Market volatility, ETF approval uncertainty, possible short-term corrections
Conclusion
XRP’s fundamentals in 2025 are the strongest they have been in years, thanks to regulatory clarity, institutional interest, technological upgrades, and real-world adoption in global payments. The prospect of an XRP ETF and Ripple’s push for bank and enterprise integration are key drivers. However, investors should remain aware of volatility and regulatory risks
#xrp #btc #sol

XRP | SHORT CRIPPLE to $2XRP is currently trading BEARISH, since we're seeing a trade right on top of the current support level.
The more times a support level is testes, the weaker it becomes. Therefore, the current support may break and then it's a free-fall to $2.
Additionally, with the price trading UNDER the moving averages in the 4h, we can confirm a bearish sentiment from a technical indicator perspective.
With a fairly tight SL, and a modest TP, the risk is low with this short setup:
___________________
BINANCE:XRPUSDT

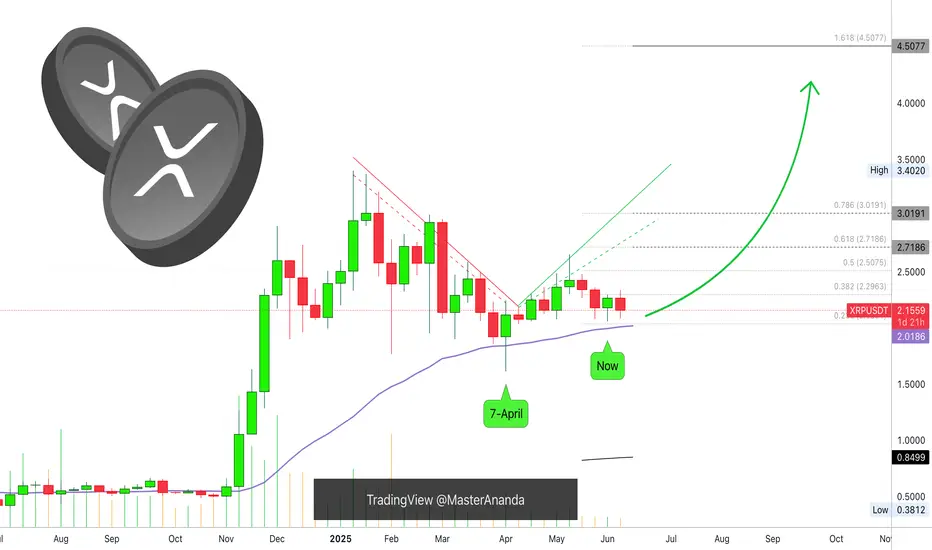
XRP Weekly UpdateThe line on the chart stands for EMA34. Notice two things about this level: 1) It was challenged 7-April but the action closed above. 2) The action "now" remains above this level but it has not been tested again, this is a bullish signal.
When it comes to the weekly timeframe, long-term, XRPUSDT continues bullish, with a bullish bias aiming higher. What we are seeing now is consolidation, accumulation, nothing changes and we can expect more growth.
Yes, the market shakes a little bit but this is the classic short-term noise. Zoom out, what do you see? You see just a few candles, red and green, but no change at all. The market is advancing to the side, after this side-advance, it will advance up; a bullish jump.
EMA34 sits at $2.01. We are strongly bullish above this level. We can expect growth in matter of weeks. Can be 1-3 weeks but it can also happen within days.
The retrace was small, consolidation has been going long enough. We are ready to start the next bullish wave.
Namaste.
HolderStat┆XRPUSD narrowing of volatilityCRYPTOCAP:XRP
→ Higher-low ladder pushes into falling-wedge roof
↳ Daily close > 2.40–2.45 = breakout to 2.55–2.65
⇢ Rising base holds at 2.10
⤴ Break < 2.10 opens 2.00–1.95 liquidity pit

XRP/USDT Reversal Play: Bounce from Strong Demand Zone🔍 Chart Analysis:
🟫 Strong Supply Zone: The price has bounced perfectly off a strong demand zone (labeled "strong supply zone" in the chart, but likely intended to be demand), showing buyer interest near the $2.05–$2.12 range.
📉 Recent Downtrend: XRP recently experienced a sharp decline, but the price has now touched this critical zone, suggesting a potential bullish reversal.
🔁 Potential U-Shaped Recovery: A rounded reversal pattern is indicated with the red curve, aiming for a U-shaped recovery targeting higher resistance levels.
📊 EMA 70 (2.2932): Current price is trading below the EMA, which acts as a short-term resistance. A break above it would be bullish confirmation.
📌 1st Resistance: Around $2.2932, which aligns with the EMA. This is the first challenge for bulls.
📌 2nd Resistance: Near $2.40–$2.47, a critical barrier before long-term targets.
🎯 Long-Term Target: Set near $2.63, the peak from the previous rally, aligning with major resistance.
🕯 Volume: Decent volume spike at the bounce, confirming interest from buyers.
🧠 Trade Setup: Reversal from Strong Demand Zone
📍 Entry Zone:
🔹 Enter between $2.12 – $2.15 (ideal after confirming a bounce or bullish candle above the zone)
🛡️ Stop-Loss (SL):
🔻 Place below the demand zone — $2.05
(Protects from deeper downside if support breaks)
🎯 Take Profit (TP) Targets:
TP1 – $2.29 (🟦 1st Resistance / EMA 70)
🔸 Partial profit booking here; break-even SL for the rest
TP2 – $2.40 (🟦 2nd Resistance)
🔸 Major resistance zone; expect a reaction
TP3 – $2.63 (🔴 Long-term Target / Previous High)
🔸 Full target for position holders
📊 Risk/Reward Ratio:
Approximately 1:2.5 to 1:3.5, depending on entry
🔔 Extra Notes:
📈 Watch for bullish engulfing or hammer candle confirmation before entering.
🔄 If price fails to reclaim EMA 70, re-evaluate trade.
🧠 Manage position size properly — avoid over-leverage.
🔮 Summary:
XRP is attempting a bullish reversal from a key demand zone with potential to target $2.47 and even $2.63 long term, provided it clears resistance at $2.29 and $2.40. The setup favors swing traders and position holders looking for a recovery play.
💡 Strategy Tagline:
"Buy the bounce, trail the breakout, ride the reversal!" 🚀📈💹
support my idea and comment down your thoughts thanks .
